
Quadratic Equation Solver with Graph
Loading the math board and drawing, please wait…
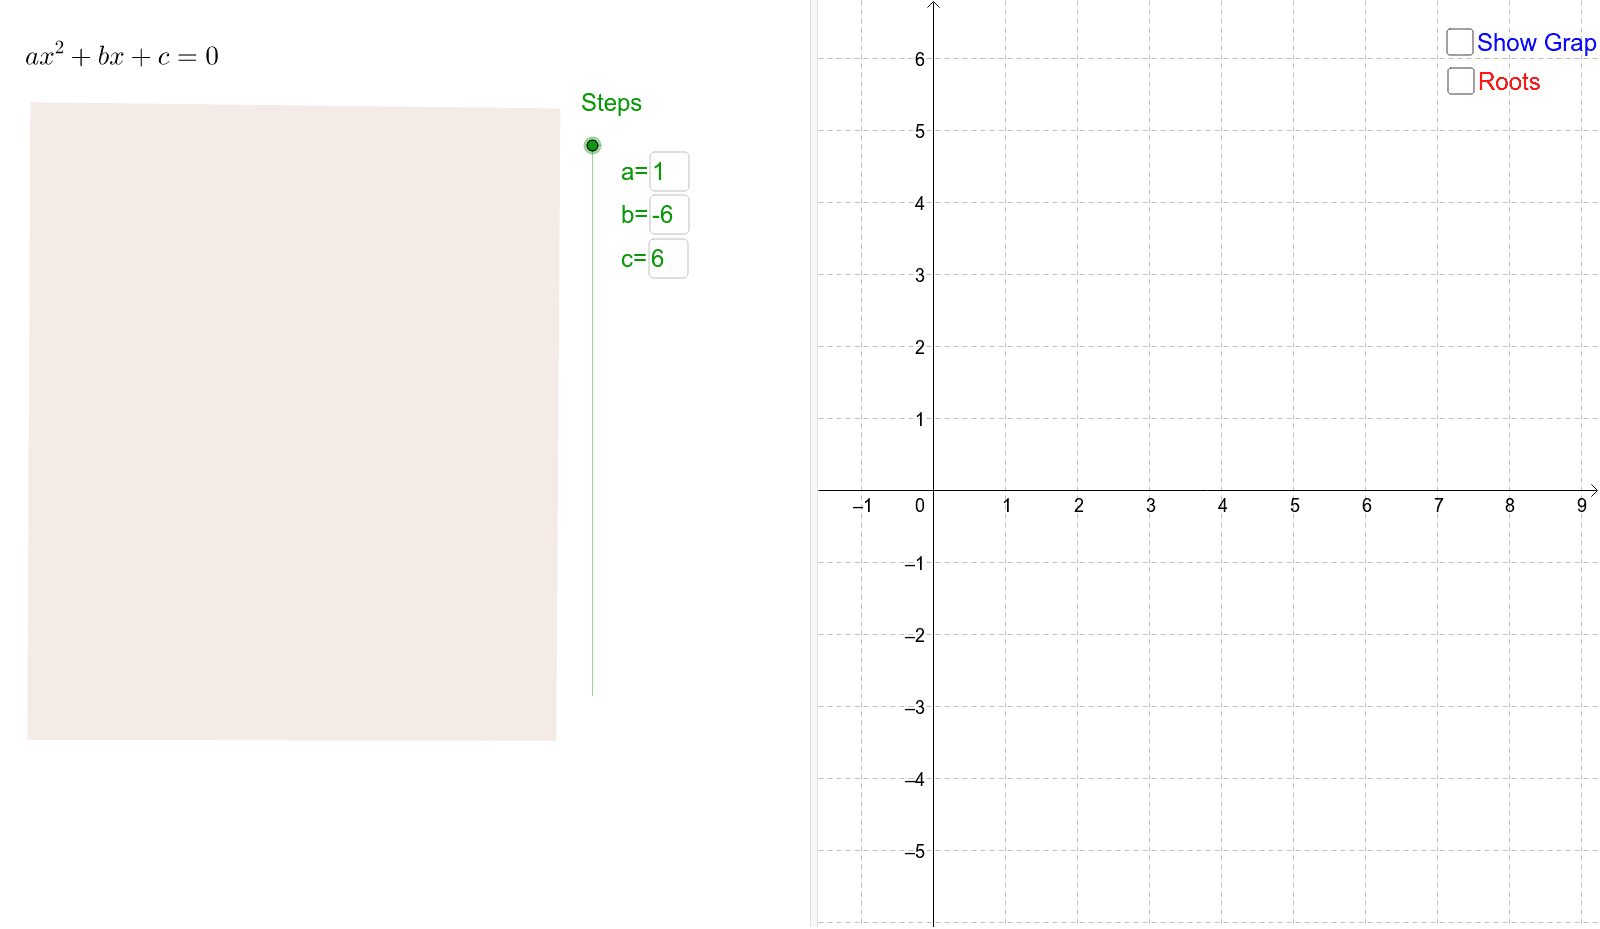
This example demonstrates the solving process of quadratic equations, their graphical representation, and root calculation. It involves core math concepts like quadratic functions, discriminant, and the relationship between function graphs and roots. Constructed using GeoGebra commands/objects such as Textfield, Root, Polygon, Intersect, suitable for high school mathematics teaching and student exploration of quadratic equation properties.
GeoGebra Commands & Parameters
Textfield(a) → Inputbox1Textfield(b) → inputBox2Textfield(c) → inputBox3Root(f) → A, BPolygon(D, C, F, E) → poly1, d_1, c_1, f_1, eIntersect(f, xAxis) → G, H
AI Drawing Prompt Reference
Draw a quadratic function graph, input the values of a, b, and c, show the graph of the function f(x)=ax^2+bx+c, find the intersection points G and H with the x-axis, calculate and display the roots A and B, and use a polygon to connect these key points.
The prompt above was compiled from the original drawing commands and is for reference only.