
Visualization of MSD and RMSD
Loading the math board and drawing, please wait…
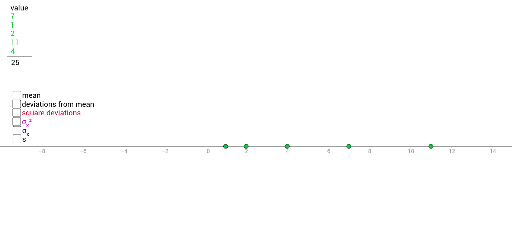
This example dynamically demonstrates Mean Squared Distance (MSD) and Root Mean Square Deviation (RMSD), key measures of data spread. It involves core math concepts like Standard Deviation, Indefinite Integral, Rhombus, Confidence Interval, Pyramid, LCM and GCD. GeoGebra commands used include Point, Polygon, and Midpoint for constructing the visualization. Suitable for high school and above, focusing on quantitative spatial data analysis.
GeoGebra Commands & Parameters
Point(xAxis) → APoint(xAxis) → EPoint(xAxis) → DPoint(xAxis) → CPoint(xAxis) → BPolygon(M, A, A2, A3) → P, a1, a4, a2, a3Polygon(M, B, B2, B3) → Q, b4, b1, b2, b3Polygon(M, C, C2, C3) → R, c4, c1, c2, c3Polygon(M, D, D2, D3) → S, d4, d1, d2, d3Polygon(M, E, E2, E3) → T, e4, e1, e2, e3Polygon(M, S2, S3, S4) → U, s1, s2, s3, s4Midpoint(S3, S4) → S5