
Quadratic Equation Solver with Steps and Graph
Loading the math board and drawing, please wait…
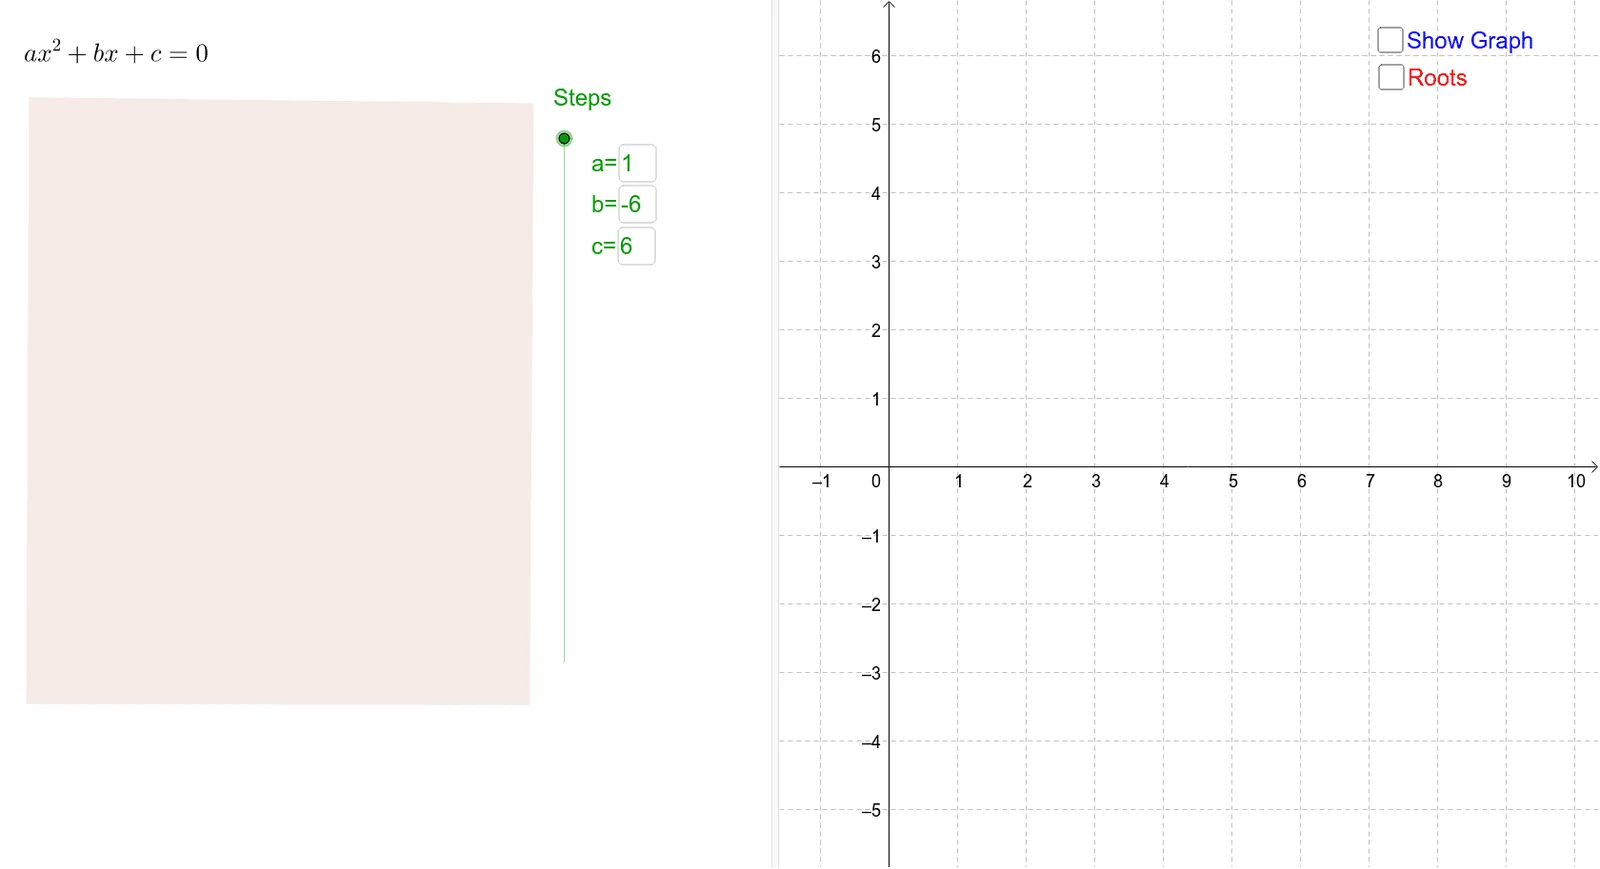
This GeoGebra example demonstrates solving quadratic equations using the formula and shows the graph of the equation. Key math concepts include roots of a quadratic equation, function graph, and slider animation. By changing the values of coefficients a, b, and c, you can observe how the roots change. Suitable for students in middle school and above to learn about quadratic equations.
GeoGebra Commands & Parameters
Textfield(a) → Inputbox1Textfield(b) → inputBox2Textfield(c) → inputBox3Root(f) → A, BPolygon(D, C, F, E) → poly1, d_1, c_1, f_1, eIntersect(f, xAxis) → G, H
AI Drawing Prompt Reference
Draw the graph of a quadratic function and show its intersections with the x-axis as roots. Use sliders to adjust the values of coefficients a, b, and c, and observe how the roots change. Connect the roots with line segments to form a polygon. Label the values of coefficients a, b, and c, and the positions of the roots next to the graph.
The prompt above was compiled from the original drawing commands and is for reference only.