
Derivative Graphing Example by Laura Kinnel (2)
Loading the math board and drawing, please wait…
In collections
Sketching Derivatives
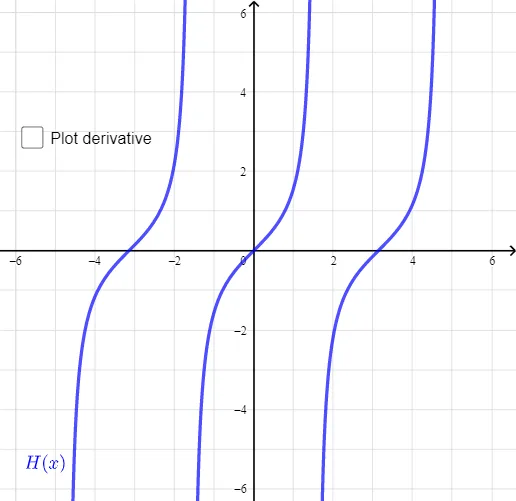
This example demonstrates how to sketch the derivative of a given function. The key mathematical concepts involve the geometric meaning of derivatives and their construction. The GeoGebra commands used include f', a, A, g, B, h, b. Suitable for high school students or college freshmen learning calculus basics.
GeoGebra Commands & Parameters
f(x) = If[(-3 * π / 2) ≤ x ≤ (3 * π / 2), tan(x)]f'(x) = f'(x)Numeric a(-6.6)(a, f(a))g(x) = If[a - 1 ≤ x ≤ a + 1, f(a) + (f'(a) * (x - a))](a, f'(a))f'(x)Boolean b(false)
AI Drawing Prompt Reference
Draw the derivative graphing setup in one coordinate plane. Use f(x)=tan(x) restricted to the domain -3π/2 ≤ x ≤ 3π/2, then plot the derivative curve f'(x). Choose a numeric value a = -6.6 and mark the point (a, f(a)) on the original function. Also mark (a, f'(a)) on the derivative. Construct a local linear approximation function g(x) that is only defined for x between a−1 and a+1, with g(x) = f(a) + f'(a)(x − a), and display g(x) over that interval. Finally, show the full curve of f'(x) together with these marked points.
The prompt above was compiled from the original drawing commands and is for reference only.