
Derivative Graphing Example by Laura Kinnel
Loading the math board and drawing, please wait…
In collections
Sketching Derivatives
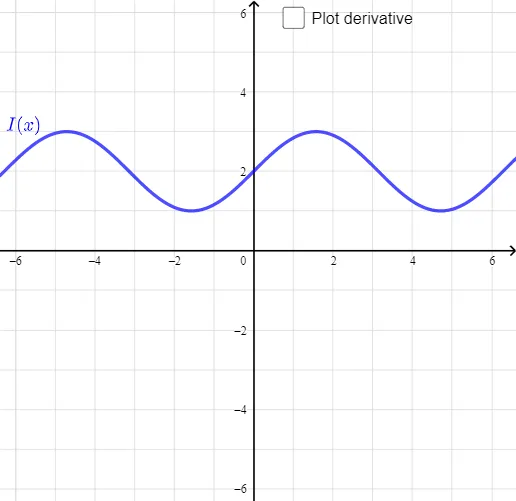
This example demonstrates how to sketch the derivative of a given function. Key mathematical concepts include the geometric meaning of the derivative, tangent slope, and rate of change. Construction involves GeoGebra commands f, f', a, A, g, B, h, b. Suitable for high school students or college freshmen to understand derivative concepts and graph analysis.
GeoGebra Commands & Parameters
f(x) = 2 + sin(x)f'(x) = f'(x)Numeric a(-7)(a, f(a))g(x) = If[a - 1 ≤ x ≤ a + 1, f(a) + (f'(a) * (x - a))](a, f'(a))f'(x)Boolean b(false)
AI Drawing Prompt Reference
Draw the graph of the function f(x) = 2 + sin(x) and its derivative f'(x). First, plot the function f(x). Then, calculate and plot f'(x). Next, choose a point a on the x-axis, and plot the function value f(a) and the derivative value f'(a) at this point. Finally, draw the tangent line passing through the point (a, f(a)) with slope f'(a).
The prompt above was compiled from the original drawing commands and is for reference only.