
Derivative Builder: Function and Derivative Graph Relationship
Loading the math board and drawing, please wait…
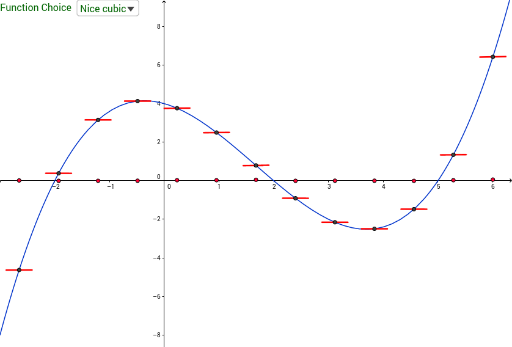
This example dynamically demonstrates the relationship between a function and its derivative using GeoGebra, helping students visualize the geometric meaning of derivatives. Key mathematical concepts include derivative definition, function graph transformations, and geometric construction. Construction involves using commands like Element, Corner, Point, and others. Suitable for high school students learning calculus fundamentals or for math teaching support.
GeoGebra Commands & Parameters
Element(flist, SelectedIndex[fNameList]) → fCorner(3) → c3Corner(1) → c1Point(x = B1) → C1Point(x = B2) → C2Point(x = B3) → C3Point(x = B4) → C4Point(x = B5) → C5Point(x = B6) → C6Point(x = B7) → C7Point(x = B8) → C8Point(x = B9) → C9Point(x = B10) → C10Point(x = B11) → C11Point(x = B12) → C12Point(x = B13) → C13Point(x = B14) → C14Point(x = B15) → C15Point(x = B16) → C16Point(x = B17) → C17Point(x = B18) → C18Point(x = B19) → C19Point(x = B20) → C20If(togfp ≟ 0, "Show f'(x)", "Hide f'(x)") → ShowHidefprimeSegment(D1 + ((h * delx / 2) * (1, y(C1))), D1 - ((h * delx / 2) * (1, y(C1)))) → E1Segment(D2 + ((h * delx / 2) * (1, y(C2))), D2 - ((h * delx / 2) * (1, y(C2)))) → E2Segment(D3 + ((h * delx / 2) * (1, y(C3))), D3 - ((h * delx / 2) * (1, y(C3)))) → E3Segment(D4 + ((h * delx / 2) * (1, y(C4))), D4 - ((h * delx / 2) * (1, y(C4)))) → E4Segment(D5 + ((h * delx / 2) * (1, y(C5))), D5 - ((h * delx / 2) * (1, y(C5)))) → E5Segment(D6 + ((h * delx / 2) * (1, y(C6))), D6 - ((h * delx / 2) * (1, y(C6)))) → E6Segment(D7 + ((h * delx / 2) * (1, y(C7))), D7 - ((h * delx / 2) * (1, y(C7)))) → E7Segment(D8 + ((h * delx / 2) * (1, y(C8))), D8 - ((h * delx / 2) * (1, y(C8)))) → E8Segment(D9 + ((h * delx / 2) * (1, y(C9))), D9 - ((h * delx / 2) * (1, y(C9)))) → E9Segment(D10 + ((h * delx / 2) * (1, y(C10))), D10 - ((h * delx / 2) * (1, y(C10)))) → E10Segment(D11 + ((h * delx / 2) * (1, y(C11))), D11 - ((h * delx / 2) * (1, y(C11)))) → E11Segment(D12 + ((h * delx / 2) * (1, y(C12))), D12 - ((h * delx / 2) * (1, y(C12)))) → E12Segment(D13 + ((h * delx / 2) * (1, y(C13))), D13 - ((h * delx / 2) * (1, y(C13)))) → E13Segment(D14 + ((h * delx / 2) * (1, y(C14))), D14 - ((h * delx / 2) * (1, y(C14)))) → E14Segment(D15 + ((h * delx / 2) * (1, y(C15))), D15 - ((h * delx / 2) * (1, y(C15)))) → E15Segment(D16 + ((h * delx / 2) * (1, y(C16))), D16 - ((h * delx / 2) * (1, y(C16)))) → E16Segment(D17 + ((h * delx / 2) * (1, y(C17))), D17 - ((h * delx / 2) * (1, y(C17)))) → E17Segment(D18 + ((h * delx / 2) * (1, y(C18))), D18 - ((h * delx / 2) * (1, y(C18)))) → E18Segment(D19 + ((h * delx / 2) * (1, y(C19))), D19 - ((h * delx / 2) * (1, y(C19)))) → E19Segment(D20 + ((h * delx / 2) * (1, y(C20))), D20 - ((h * delx / 2) * (1, y(C20)))) → E20Point(x = B21) → C21Segment(D21 + ((h * delx / 2) * (1, y(C21))), D21 - ((h * delx / 2) * (1, y(C21)))) → E21Point(x = B22) → C22Segment(D22 + ((h * delx / 2) * (1, y(C22))), D22 - ((h * delx / 2) * (1, y(C22)))) → E22Point(x = B23) → C23Segment(D23 + ((h * delx / 2) * (1, y(C23))), D23 - ((h * delx / 2) * (1, y(C23)))) → E23Point(x = B24) → C24Segment(D24 + ((h * delx / 2) * (1, y(C24))), D24 - ((h * delx / 2) * (1, y(C24)))) → E24Point(x = B25) → C25Segment(D25 + ((h * delx / 2) * (1, y(C25))), D25 - ((h * delx / 2) * (1, y(C25)))) → E25Point(x = B26) → C26Segment(D26 + ((h * delx / 2) * (1, y(C26))), D26 - ((h * delx / 2) * (1, y(C26)))) → E26Point(x = B27) → C27Segment(D27 + ((h * delx / 2) * (1, y(C27))), D27 - ((h * delx / 2) * (1, y(C27)))) → E27Point(x = B28) → C28Segment(D28 + ((h * delx / 2) * (1, y(C28))), D28 - ((h * delx / 2) * (1, y(C28)))) → E28Point(x = B29) → C29Segment(D29 + ((h * delx / 2) * (1, y(C29))), D29 - ((h * delx / 2) * (1, y(C29)))) → E29Point(x = B30) → C30Segment(D30 + ((h * delx / 2) * (1, y(C30))), D30 - ((h * delx / 2) * (1, y(C30)))) → E30Textfield(f6) → InputfElement(fPrimeList, SelectedIndex[fNameList]) → f'
AI Drawing Prompt Reference
Create a dynamic visualization showing the relationship between a function and its derivative. Plot a selected function curve. Place a series of equally spaced points along the curve)Skip. At each point, draw a short line segment centered on the point, with its length proportional to the function value at that point, representing the derivative. Additionally, plot the derivative values as a separate curve. Include controls to adjust the segment length and toggle the derivative display, illustrating the geometric meaning of the derivative as the slope of the tangent.
The prompt above was compiled from the original drawing commands and is for reference only.