
Risk Portfolio Analysis
Loading the math board and drawing, please wait…
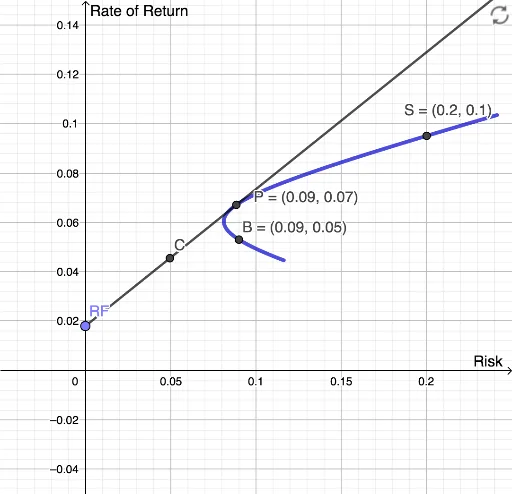
This example demonstrates the analysis of a portfolio consisting of three investment tools (one risk-free and two risky). Key mathematical concepts include function graphs, vectors, and slider animations. By examining the commands in the construction summary, one can understand how to use GeoGebra to draw these investment portfolio graphs. Suitable for learners of finance and investment.
GeoGebra Commands & Parameters
Segment(S, B) → fRay(RF, P) → gCurveCartesian(sqrt(sP2(t)), rP(t), t, -0.2, 1.2) → a
AI Drawing Prompt Reference
Draw a portfolio analysis graph including one risk-free and two risky investments, showing three function curves, one ray for the risk-free investment, one segment for one risky investment, and use a slider to dynamically adjust parameters to display the changes in the investment portfolio.
The prompt above was compiled from the original drawing commands and is for reference only.