
Derivative as a Function: Dynamic Tangent Slope Graphing
Loading the math board and drawing, please wait…
In collections
Fun with Functions
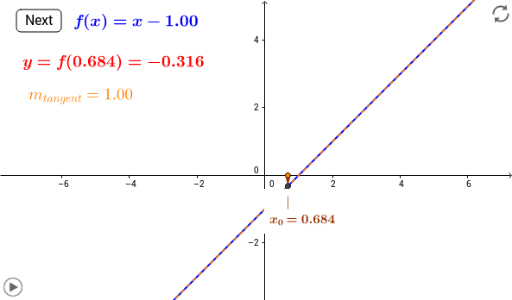
This GeoGebra example demonstrates how the slope of the tangent line to a curve is displayed and traced on a secondary graph as a point moves along the original function, thereby visualizing the derivative as a function. It explores several common functions, illustrating the correspondence between a function and its derivative. Core mathematical concepts include the derivative as a function, tangent slope, instantaneous rate of change, and the graphical relationship between f and f′. Construction relies on GeoGebra commands such as Element, Point, Vector, Textfield, Tangent, Slope, and Locus, with objects including function list flist, individual functions f_1 through f_13, points A, B, C, D, E, F, G, O, H, input elements button1 and inputBox1, and dynamic text labels. Suitable for high school calculus and introductory university calculus courses, ideal for classroom demonstration and student inquiry into the geometric meaning of derivatives.
GeoGebra Commands & Parameters
Element(flist, nf) → gPoint(xAxis) → AVector(A, B) → uTextfield(f_{13}) → inputBox1Tangent(B, g) → bSlope(b) → mLocus(J, A) → loc1
AI Drawing Prompt Reference
Draw a dynamic graph showing the relationship between a function and its derivative. A moving point on the curve represents the function value, and the derivative is shown as a slope on another graph. The graph includes a function list, the curve, points, derivative points, and dynamic labels. The construction order is to draw the curve first, then add points, calculate the derivative, and finally display the derivative graph.
The prompt above was compiled from the original drawing commands and is for reference only.