
Dependent Difference Test of Two Means
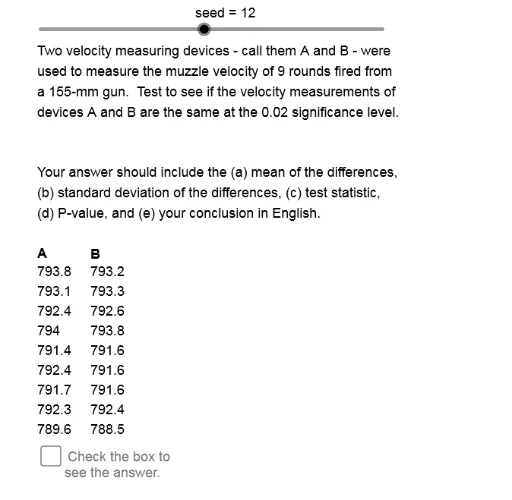
Loading the math board and drawing, please wait…
This example demonstrates the statistical visualization of the dependent difference test for two means. It involves core mathematical concepts like mean, standard deviation, statistical characteristics, quadratic equations, differences, and slopes. The construction utilizes GeoGebra commands such as Sequence, Element, Length, mean, stdev, If, along with objects like Dt1A to Dt6B. It is suitable for high school students and beginners in statistics.
GeoGebra Commands & Parameters
Sequence(Mod[5 + (13 * k), 29] + 20, k, 1, 24) → OpSqElement(OpSq, seed) → OpNm1Element(CnfSq, Op2) → ConfElement(DtASq, Op1) → DtAElement(DtBSq, Op1) → DtBLength(DtA) → SizeSequence(Element[DtA, k] - Element[DtB, k], k, 1, Size) → DffSqmean(DffSq) → Xbrstdev(DffSq) → StDvIf(PVal < α, 1, 0) → CmprIf(Cmpr ≟ 1, "Reject", "Keep") → DcsnIf(Cmpr ≟ 1, "is", "is not") → ConStmtIf(PVal < α, " < ", " ≥ ") → IneqSqnIf(TstSt < 0, "1E99", TstSt) → UBTxIf(PVal < 0.0005, 0.0005, PVal) → SmPVIf(PVal < 0.0005, "<", "=") → PVIEElement(PSSq, Op1) → PS0Element(LbASq, Op1) → LbAElement(LbBSq, Op1) → LbBSequence(Text[Element[DtA, k], (0.5, DtTp - (0.52 * k))], k, 1, Size) → DtATxSequence(Text[Element[DtB, k], (1.9, DtTp - (0.52 * k))], k, 1, Size) → DtBTxSequence(Text[Element[DffSq, k], (3.6, DtTp - (0.52 * k))], k, 1, Size) → DffSqTx
AI Drawing Prompt Reference
Draw a statistical test graph for the difference of two sample means, including data points for sample A and sample B, difference points, mean Xbr and standard deviation StDv, and the comparison result of P-value PVal and significance level α. Sample A and sample B data points are located on the left and right sides of the coordinate system, respectively, difference points are in the middle, mean Xbr and standard deviation StDv are represented by line segments, and the comparison result of P-value PVal and α is annotated with text.
The prompt above was compiled from the original drawing commands and is for reference only.