
Demonstration of the Geometric Meaning of Definite Integrals
Loading the math board and drawing, please wait…
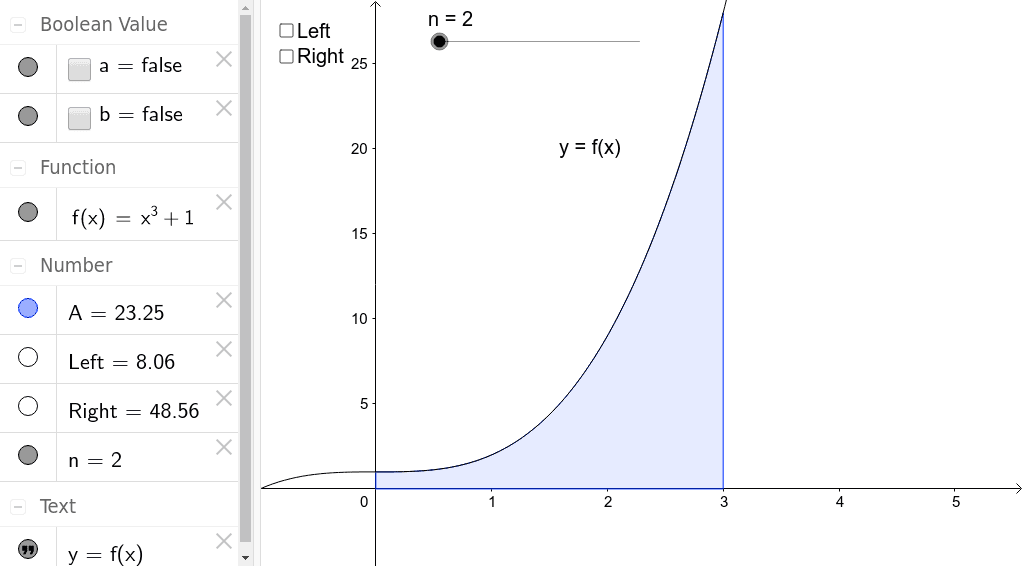
This example demonstrates the estimation of the area represented by a definite integral using two different sets of rectangles by checking the 'Left' or 'Right' checkboxes. It involves core mathematical concepts such as definite integrals, continuity, bar charts, geometric mean, tangent functions, and trigonometric functions. It is constructed using GeoGebra commands UpperSum, Integral, LowerSum and objects like f, n, text1, Right, A, Left, a, b, making it suitable for high school and above students to understand the geometric meaning and numerical calculation of definite integrals.
GeoGebra Commands & Parameters
UpperSum(f, 0, 3, n) → RightIntegral(f, 0, 3) → ALowerSum(f, 0, 3, n) → Left
AI Drawing Prompt Reference
Draw a graph of a function curve over the interval from 0 to 3, showing the area under the curve representing a definite integral. Approximate this area in two ways: one using left-endpoint rectangles (each rectangle's height equals the function value at the left endpoint of each subinterval), and another using right-endpoint rectangles. Also display the exact integral area, using different colors or transparencies to distinguish left rectangles, right rectangles, and the exact area. The number of rectangles should be adjustable to observe how the approximation changes. Include coordinate axes, the function curve, the rectangular strips, and labels for the integral region boundaries.
The prompt above was compiled from the original drawing commands and is for reference only.