
Demonstration of Slope-Intercept Form
Loading the math board and drawing, please wait…
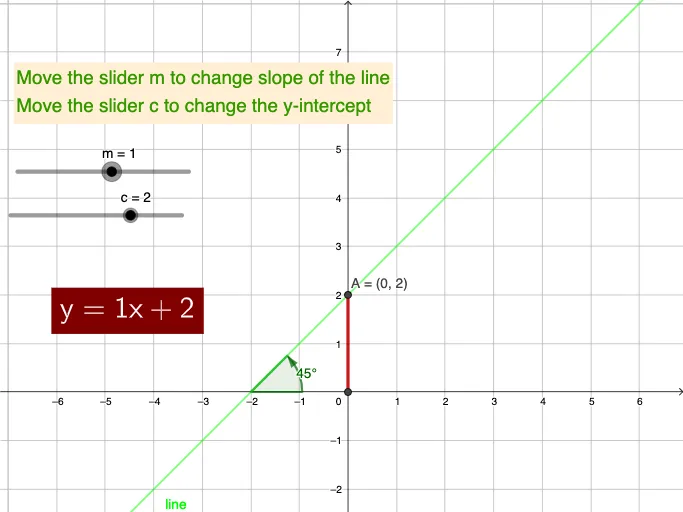
This example dynamically demonstrates the function graph of the slope-intercept form y=mx+c, showing the positional relationship of the line as the slope m and y-intercept c change. Core math concepts include linear functions, slope, y-intercept, and analytical geometry. Construction highlights involve GeoGebra commands/objects like Intersect, Segment, Angle, Point, Rotate, and If. Suitable for middle school and above students to learn function graph characteristics and parameter effects, and high school analytical geometry teaching.
GeoGebra Commands & Parameters
Intersect(line, yAxis) → AIntersect(xAxis, yAxis) → BSegment(B, A) → fAngle(xAxis, line) → αPoint(line) → DIntersect(line, xAxis) → FPoint(xAxis) → EIntersect(line, xAxis) → CRotate(B, Deg°, C) → B'Angle(B, C, B') → βPoint(line) → GIf(c < 0, Text[c], If[c ≟ 0, " ", "+" + (Text[c])]) → c'