
Definite Integral Illustrator (I)
Loading the math board and drawing, please wait…
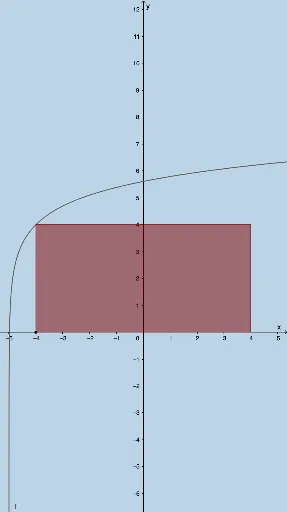
This example illustrates the concept of definite integrals, visually demonstrating the calculation method. Key mathematical concepts include definite integrals, median lines, derivatives, intersections, exponential functions, and function graphs. GeoGebra commands used include Textfield, Sequence, Translate, LeftSum, Sum, Intersect, Polygon, Integral, etc. Suitable for high school mathematics education and learning.
GeoGebra Commands & Parameters
Textfield(f) → InputBox1Textfield(a) → InputBox2Textfield(b) → InputBox3Sequence((a + (i * deltax), 0), i, 1, n, 1) → rightxSequence((a + (i * deltax), f(a + (i * deltax))), i, 1, n, 1) → fofrightxSequence((a + (i * deltax), 0), i, 0, n - 1, 1) → leftxSequence(Midpoint[Element[leftx, i], Element[rightx, i]], i, 1, n, 1) → midpointsSequence((a + (i * deltax), f(a + (i * deltax))), i, 1, n, 1) → list1Translate(list1, (deltax, 0)) → list1'LeftSum(f, a, b, n) → lSequence(x = x(Element[midpoints, i]), i, 1, n, 1) → list2Sequence(Intersect[f, Element[list2, i], (0, 5.6094379124341005)], i, 1, n, 1) → list3Translate(list3, (deltax / 2, 0)) → midpointtoprightTranslate(list3, (((-deltax)) / 2, 0)) → midpointtopleftTranslate(midpoints, (deltax / 2, 0)) → midpoints'Translate(midpoints, (((-deltax)) / 2, 0)) → midpoints'_1Sequence(Polygon[Element[midpoints'_1, i], Element[midpoints', i], Element[midpointtopright, i], Element[midpointtopleft, i]], i, 1, n, 1) → list4Sum(list4) → hTranslate(list1, ((-deltax), 0)) → list1'_1Translate(rightx, ((-deltax), 0)) → rightx'Sequence(Polygon[Element[rightx, i], Element[list1, i], Element[list1'_1, i], Element[rightx', i]], i, 1, n, 1) → rightrectanglesumSum(rightrectanglesum) → jIntersect(k, p) → FIntersect(m, k) → GPolygon(D, E, G, F) → poly1, d_1, e, g_1, f_1Intersect(m, q) → HIntersect(p, q) → IPolygon(D, E, H, I) → poly2, d_2, e_1, h_1, i_1Intersect(p, r) → JIntersect(r, m) → KPolygon(D, E, K, J) → poly3, d_3, e_2, k_1, j_1Integral(f, a, b) → s
AI Drawing Prompt Reference
Illustrate the concept of definite integrals by drawing a function graph and its calculation. Start with the function curve, then divide the interval from a to b into n subintervals, marking midpoints and endpoints. Represent the function values with rectangles for each subinterval, summing up to approximate the integral from the left and right. Finally, connect the function on the integral interval with a solid line and display the exact integral value.
The prompt above was compiled from the original drawing commands and is for reference only.