
Probability Density Function: Area Interpretation via Integral
Loading the math board and drawing, please wait…
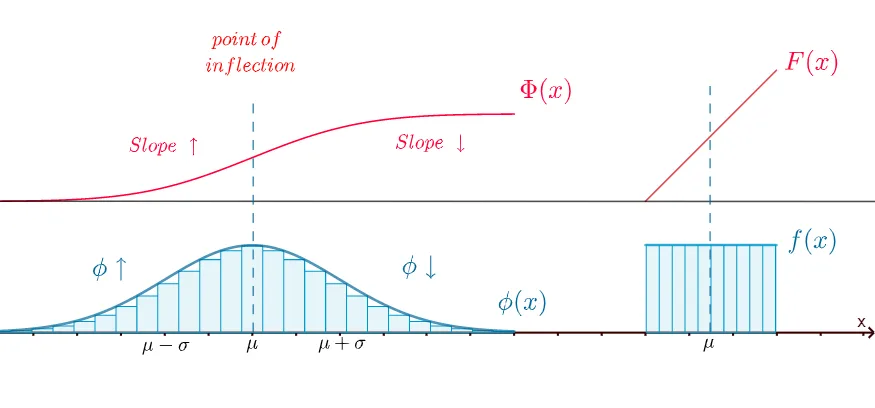
This GeoGebra example demonstrates how a probability density function (PDF) represents a distribution and how the probability over an interval corresponds to the area under its curve. It emphasizes the geometric meaning of integration by approximating the integral with Riemann-sum style “lower sums” on a selected domain. Key concepts include probability density functions, graphing a function to visualize distribution, and using calculus (integral/area) to compute probabilities from continuous models. Construction-wise, it uses GeoGebra commands such as Integral for the exact computation and LowerSum together with Segment to build interval partitions and the under-approximation area. It also employs objects like Point and Intersect to mark boundaries/critical intersections, and uses function/curve objects (e.g., f, g, h) plus coordinate bounds (xmin/xmax, ymin/ymax) and on-graph text annotations to organize the visualization. Suitable for high-school advanced probability, introductory undergraduate probability/statistics, and calculus-integral interpretation lessons.
GeoGebra Commands & Parameters
Integral(g(x), 0, b) → tIntegral(l(x), 0, b) → aVector(C, B) → uVector(C, A) → vIntersect(f, yAxis, (0, 3.0026997960632604)) → DIntersect(f, yAxis, (0, 3.0026997960632604)) → FPoint(yAxis) → HPoint(yAxis) → JLowerSum(l(x), 0, 12, 25) → cLowerSum(gd(x), 15.02, 17.98, 10) → dIntersect(f, yAxis, (0, 3.0026997960632604)) → LSegment(L, M) → iPoint(xAxis) → NSegment(N, O) → jPoint(xAxis) → PSegment(P, Q) → k
AI Drawing Prompt Reference
Draw a probability density function curve and use rectangles to approximate the area under the curve in the interval [0, b]. Mark points H and J on the y-axis and points N and P on the x-axis. Use functions f and g to represent the probability density function and calculate probabilities using integrals. Construct rectangle approximations with the LowerSum command in selected intervals to illustrate the geometric meaning of the probability density function.
The prompt above was compiled from the original drawing commands and is for reference only.