
De Méré's Problem Simulation
Loading the math board and drawing, please wait…
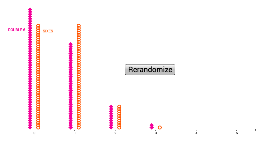
This example demonstrates De Méré's problem, involving core concepts of probability and statistics. Through random simulation, users can observe and understand probability distributions. It uses commands like Random, If, Sum, and DotPlot, suitable for high school mathematics education.
GeoGebra Commands & Parameters
Random(1, 6) → A1Random(1, 6) → B1Random(1, 6) → A2Random(1, 6) → B2Random(1, 6) → A3Random(1, 6) → B3Random(1, 6) → A4Random(1, 6) → B4Random(1, 6) → A5Random(1, 6) → B5Random(1, 6) → A6Random(1, 6) → B6Random(1, 6) → A7Random(1, 6) → B7Random(1, 6) → A8Random(1, 6) → B8Random(1, 6) → A9Random(1, 6) → B9Random(1, 6) → A10Random(1, 6) → B10Random(1, 6) → A11Random(1, 6) → B11Random(1, 6) → A12Random(1, 6) → B12Random(1, 6) → A13Random(1, 6) → B13Random(1, 6) → A14Random(1, 6) → B14Random(1, 6) → A15Random(1, 6) → B15Random(1, 6) → A16Random(1, 6) → B16Random(1, 6) → A17Random(1, 6) → B17Random(1, 6) → A18Random(1, 6) → B18Random(1, 6) → A19Random(1, 6) → B19Random(1, 6) → A20Random(1, 6) → B20Random(1, 6) → A21Random(1, 6) → B21Random(1, 6) → A22Random(1, 6) → B22Random(1, 6) → A23Random(1, 6) → B23Random(1, 6) → A24Random(1, 6) → B24If(A1 ≟ 6 ∧ B1 ≟ 6, 1, 0) → C1If(A2 ≟ 6 ∧ B2 ≟ 6, 1, 0) → C2If(A3 ≟ 6 ∧ B3 ≟ 6, 1, 0) → C3If(A4 ≟ 6 ∧ B4 ≟ 6, 1, 0) → C4If(A5 ≟ 6 ∧ B5 ≟ 6, 1, 0) → C5If(A6 ≟ 6 ∧ B6 ≟ 6, 1, 0) → C6If(A7 ≟ 6 ∧ B7 ≟ 6, 1, 0) → C7If(A8 ≟ 6 ∧ B8 ≟ 6, 1, 0) → C8If(A9 ≟ 6 ∧ B9 ≟ 6, 1, 0) → C9If(A10 ≟ 6 ∧ B10 ≟ 6, 1, 0) → C10If(A11 ≟ 6 ∧ B11 ≟ 6, 1, 0) → C11If(A12 ≟ 6 ∧ B12 ≟ 6, 1, 0) → C12If(A13 ≟ 6 ∧ B13 ≟ 6, 1, 0) → C13If(A14 ≟ 6 ∧ B14 ≟ 6, 1, 0) → C14If(A15 ≟ 6 ∧ B15 ≟ 6, 1, 0) → C15If(A16 ≟ 6 ∧ B16 ≟ 6, 1, 0) → C16If(A17 ≟ 6 ∧ B17 ≟ 6, 1, 0) → C17If(A18 ≟ 6 ∧ B18 ≟ 6, 1, 0) → C18If(A19 ≟ 6 ∧ B19 ≟ 6, 1, 0) → C19If(A20 ≟ 6 ∧ B20 ≟ 6, 1, 0) → C20If(A21 ≟ 6 ∧ B21 ≟ 6, 1, 0) → C21If(A22 ≟ 6 ∧ B22 ≟ 6, 1, 0) → C22If(A23 ≟ 6 ∧ B23 ≟ 6, 1, 0) → C23If(A24 ≟ 6 ∧ B24 ≟ 6, 1, 0) → C24Sum(C1:C24) → D1Random(1, 6) → E1Random(1, 6) → E2Random(1, 6) → E3Random(1, 6) → E4If(E1 ≟ 6, 1, 0) → F1If(E2 ≟ 6, 1, 0) → F2If(E3 ≟ 6, 1, 0) → F3If(E4 ≟ 6, 1, 0) → F4Sum(F1:F4) → G1DotPlot(doubles, false, 0.15) → list1DotPlot(singles, false, 0.15) → list2
AI Drawing Prompt Reference
Create a simulation of De Méré's problem. Show 24 pairs of dice rolls, each pair represented by two adjacent dots with values from 1 to 6, arranged in a grid. Below, display a dot plot of the sum of each pair (ranging from 2 to 12) with frequency on the vertical axis. Include a slider to adjust the number of trials, and highlight the proportion of rolls where at least one die shows a 6. The layout should be clean and educational, emphasizing the probability distribution.
The prompt above was compiled from the original drawing commands and is for reference only.