
Curve Sketching using First and Second Derivatives
Loading the math board and drawing, please wait…
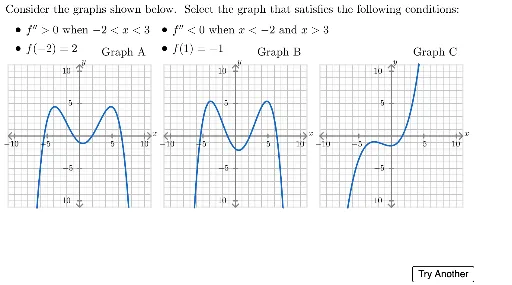
This example demonstrates how to sketch function graphs using first and second derivatives. The core math concepts involved include derivatives, function graphs, straight lines, dilation, and terms. Construction highlights: The GeoGebra commands used are Zip, Random, If, Element, UnicodeToLetter, Shuffle, Polygon, TableText, Translate, IndexOf, Sequence, Join, LaTeX; objects include xVals, axisArrows, multiplier, Afx1, Afx3, Afx2, Afpx1, caseNum, Ax1Indx, Ax1, Mf23, Mf22, Mf21, Case2Matrices, Case2Solutions, Case2Coeffs, f23, f22, f21, Case2, Ax3Indx, Ax2Indx, Ax2, Mf13, Ax3, Mf11, Mf12, Case1Matrices, Case1Solutions, Case1Coeffs, f13, f12, f11, Case1, bullet, chosenGraphs, inequality1, questionOrder, transVectors, displayOrder. Suitable for high school and above learning calculus and function graphing.
GeoGebra Commands & Parameters
Zip(Rotate[{Segment[(11, 0), (10.5, 0.5)], Segment[(11, 0), (10.5, -0.5)]}, A, (0, 0)], A, {0, 90°, 180°, 270°}) → axisArrowsRandom(1, 6) → Ax1IndxIf(caseNum ≟ 1, Element[xVals, Ax1Indx], (Random[1, 3] * (-1)^(Random[0, 1]))) → Ax1Zip(ReducedRowEchelonForm[A], A, Case2Matrices) → Case2SolutionsZip(Sequence[Element[A, i, 5], i, 1, 4], A, Case2Solutions) → Case2CoeffsZip(If[-11 < x < 11, A(x)], A, {f21, f22, f23}) → Case2Random(Ax1Indx + 2, 8) → Ax3IndxRandom(Ax1Indx + 1, Ax3Indx - 1) → Ax2IndxElement(xVals, Ax2Indx) → Ax2Element(xVals, Ax3Indx) → Ax3Zip(ReducedRowEchelonForm[A], A, Case1Matrices) → Case1SolutionsZip(Sequence[Element[A, i, 6], i, 1, 5], A, Case1Solutions) → Case1CoeffsZip(If[-11 < x < 11, A(x)], A, {f11, f12, f13}) → Case1UnicodeToLetter(9679) → bulletIf(multiplier < 1, "<", ">") → inequality1Shuffle({1, 2, 3}) → questionOrderZip(Element[transVectors, A], A, questionOrder) → displayOrderPolygon({(-11, -11), (-11, 11), (11, 11), (11, -11)}) → graphFrameIf(multiplier < 1, ">", "<") → inequality2TableText({{(((("\text{ " * bullet) * " ") * Case2Condition1) * "}"), (((("\text{" * bullet) * " ") * Case2Condition2) * "}")}, {(((("\text{" * bullet) * " ") * Case2Condition3) * "}"), (((("\text{" * bullet) * " ") * Case2Condition4) * "}")}}) → Case2ConditionsTableText({{Case1Condition1, Case1Condition2}, {Case1Condition3, Case1Condition4}}) → Case1ConditionsUnicodeToLetter(10007) → xmarkUnicodeToLetter(10003) → cmarkIf(caseNum ≟ 1, Case1, Case2) → selectedFuncsZip(Translate[C, Vector[D]], C, selectedFuncs, D, displayOrder) → allDisplayFuncsZip(Translate[graphFrame, Vector[Element[displayOrder, A]]], A, chosenGraphs) → highlightQuestionsTranslate(graphFrame, Vector[Element[displayOrder, 1]]) → graph1Translate(graphFrame, Vector[Element[displayOrder, 2]]) → graph2Translate(graphFrame, Vector[Element[displayOrder, 3]]) → graph3IndexOf(1, questionOrder) → letterIndxIf(caseNum ≟ 1, Case1Conditions, Case2Conditions) → questionConditionsSequence(Defined[IndexOf[i, answers]], i, 1, 3) → whichCorrectZip(Text[A, (3, 14) + V, true, true], A, graphTitles, V, transVectors) → allTitlesJoin({axisArrows, {Zip[Segment[(A, -0.3), (A, 0.3)], A, {-10, -5, 5, 10}], Zip[Segment[(0.3, B), (-0.3, B)], B, {10, 5, -5, -10}], {Segment[(-11, 0), (11, 0)], Segment[(0, -11), (0, 11)]}}}) → TemplateAxisZip(Translate[Join[{Sequence[Segment[(-11, i), (11, i)], i, -10, 10], Sequence[Segment[(i, 11), (i, -11)], i, -10, 10]}], Vector[A]], A, transVectors) → allGridsZip(Translate[TemplateAxis, A], A, transVectors) → allAxisZip(Zip[Text[A, B + V, true, true], A, {"-10", "-5", "5", "10", "x", "-10", "-5", "5", "10", "y"}, B, {(-12, -0.5), (-6.4, -0.5), (4.5, -0.5), (9, -0.5), (11, 1), (-4, -9.2), (-3, -4.2), (-2, 5.8), (-3, 10.8), (0, 12)}], V, transVectors) → allTxtLaTeX(If[isCorrect, txtCorrect, txtIncorrect]) → txtAnswerLaTeX((((((((("\text{" * txtAnswer) * " ") * fbConcavity) * "\\") * fbSlope) * "\\") * fbCorrectGraph) * "}")) → fbAll