
Curve of Intersection of a Sphere and Hyperbolic Paraboloid
Loading the math board and drawing, please wait…
In collections
intersection: surface-surface, curve-curve
intersection: surface-surface, curve-curve
intersection: surface-surface, curve-curve
intersection: surface-surface, curve-curve
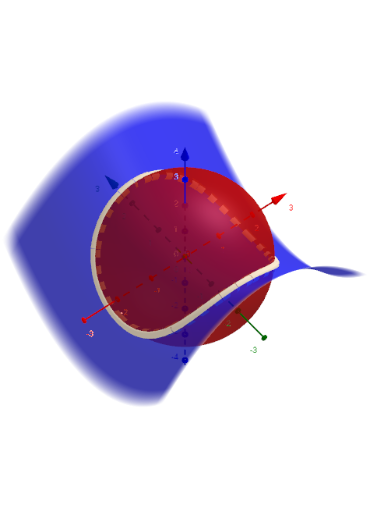
This example demonstrates the space curve formed by the intersection of a sphere and a hyperbolic paraboloid. Key math concepts include spatial analytical geometry, parametric equations, and the intersection points of surfaces and curves. Construction highlights involve LaTeX commands for formula display, Sequence for generating data, parameters r, a, d, b for controlling size and position, objects like fyz, fxz representing curve equations, and text objects (text1, text2, text3, text4) for annotations. Suitable for high school students and above learning spatial geometry, parametric equations, and 3D graphing, as well as university-level foundational mathematics education.
GeoGebra Commands & Parameters
LaTeX(a, false, false) → text1LaTeX(b, false, false) → text2Sequence(Sequence[CurveCartesian[(i * fxz(t)), (j * fyz(t)), t, t, -50, 50], i, -1, 1, 2], j, -1, 1, 2) → l1
AI Drawing Prompt Reference
Create a 3D plot showing the intersection curve of a sphere and a hyperbolic paraboloid. The curve is defined parametrically and extends symmetrically in both directions. Include labels for parameters a and b, and display four branches of the curve corresponding to different orientations. The visualization should clearly show the spatial relationship between the surfaces and the curve, with annotations for key parameters.
The prompt above was compiled from the original drawing commands and is for reference only.