
Cumulative Frequency and Box Plot Example
Loading the math board and drawing, please wait…
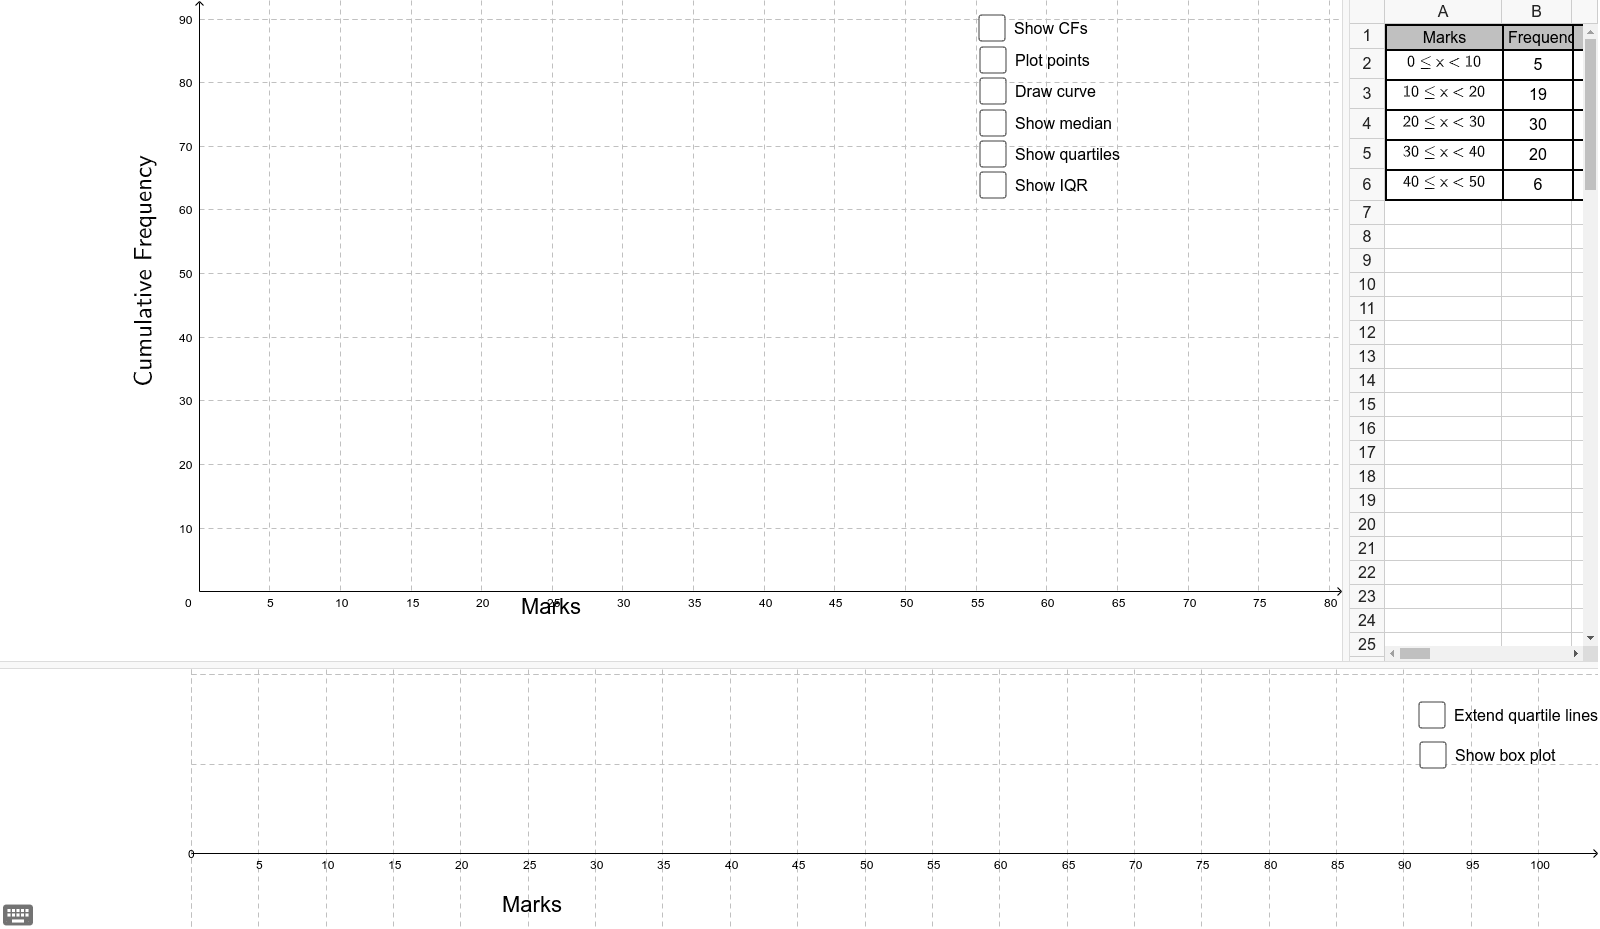
This example demonstrates how to create cumulative frequency graphs and box plots for a dataset. Key math concepts include cumulative frequency distribution, quartiles, and box plot construction. GeoGebra commands like Max, Min, BoxPlot, Line, and Segment are used in the construction. Suitable for high school mathematics education and introductory data analysis learning.
GeoGebra Commands & Parameters
Max(A6) → eMax(A5) → dMax(A4) → cMax(A3) → bMax(A2) → aPolynomial({E2, E3, E4, E5, E6, A}) → fPoint(g) → HPoint(g) → FRotateText(text1, 1.5707963267948966) → text3Segment(E, F) → Q1Segment(F, E') → kSegment(G, H) → Q3Segment(H, I) → pPoint(g) → BSegment(B, D) → lSegment(B, C) → medianMin(A2) → mBoxPlot(40, 20, m, x(E'), x(D), x(I), e) → qLine(H, I) → nLine(F, E') → a_1Ray(B, D) → b_1Line(B, D) → c_1Ray(F, E') → d_1Ray(H, I) → e_1Point(n) → JIntersect(q, d_1, 1) → KPoint(d_1) → LPoint(b_1) → MRay((x(J), 60), (x(J), 200)) → f_1Ray((x(M), 60), (x(M), 200)) → h_1Ray((x(L), 60), (x(L), 200)) → g_1
AI Drawing Prompt Reference
Draw a cumulative frequency graph and box plot for a dataset. Start by plotting the cumulative frequency distribution based on data points, identifying the maximum and minimum values. Then, locate the quartiles and construct the box plot, including the median, quartiles, and maximum/minimum values. Finally, add necessary labels and辅助 lines for clarity.
The prompt above was compiled from the original drawing commands and is for reference only.