
Cross Section Visualization
Loading the math board and drawing, please wait…
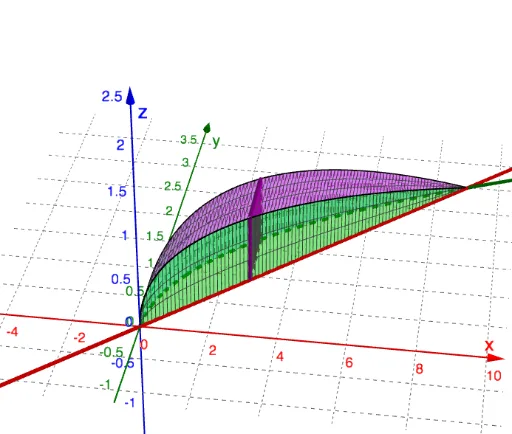
This example demonstrates the dynamic interaction of 3D geometric solids showing 2D cross-sections, particularly squares, highlighting integral calculus, solid geometry, centroid, linear functions, arithmetic mean, and vectors. It uses GeoGebra commands like Cartesian Curve, Polygon, and Surface for construction, suitable for high school and above learning complex geometry and integral concepts.
GeoGebra Commands & Parameters
CurveCartesian(t, f(t), f(t) - g(t), t, 0, 9) → aCurveCartesian(t, g(t), f(t) - g(t), t, 0, 9) → bPolygon((n, g(n), 0), (n, f(n), 0), a(n), b(n)) → q1, h, i, j, kSurface(t, g(t), (u * z(b(t))), t, 0, 9, u, 0, 1) → cSurface(t, f(t), (u * z(a(t))), t, 0, 9, u, 0, 1) → dSurface(t, (u * g(t)) + ((1 - u) * f(t)), z(a(t)), t, 0, 9, u, 0, 1) → e