
Creating Diagrams of Subsets
Loading the math board and drawing, please wait…
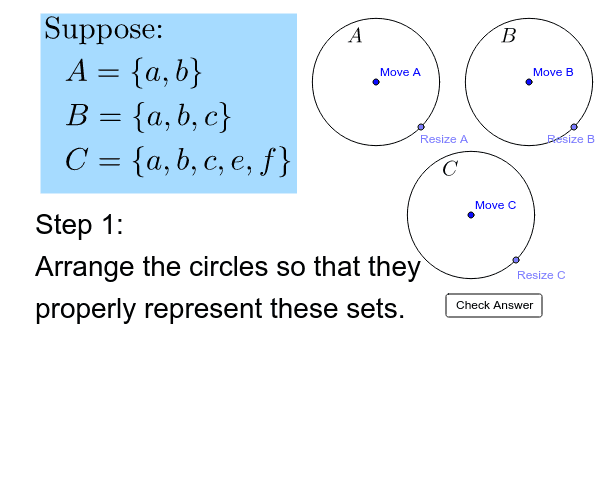
This GeoGebra worksheet presents a two-step activity where students arrange circles to create a correct Euler diagram showing subset relationships. The example demonstrates fundamental concepts in set theory, including subsets, intersections, and unions, through geometric visualization. Construction involves using GeoGebra commands such as Point for defining locations, Circle for drawing boundaries, Polygon for creating regions, and Corner for precise angles. Key objects like B_1, A_1, C_1 represent elements of sets, facilitating interactive learning. It is suitable for high school mathematics education to teach set theory and logic.
GeoGebra Commands & Parameters
Point(Line[B_1, y = -x]) → B_2Circle(B_1, B_2) → BPoint(Line[A_1, y = -x]) → A_2Circle(A_1, A_2) → APoint(Line[C_1, y = -x]) → C_2Circle(C_1, C_2) → CPolygon((x1, y1), (x1, y2), (x2, y2), (x2, y1)) → poly1, p1, p4, p3, p2Polygon(Corner[1], Corner[2], Corner[3], Corner[4]) → blankout, g, h, i, jCorner(5) → D
AI Drawing Prompt Reference
Draw an Euler diagram to show subset relationships. Start by taking points B1, A1, and C1 on a line, then draw circles B, A, and C with these points as centers. Use these points and their corresponding points B2, A2, and C2 on the lines to draw a quadrilateral, and finally use the four corners to draw a blank area representing the intersection and union of sets.
The prompt above was compiled from the original drawing commands and is for reference only.