
Cosine Functions: Dynamic Analysis of Amplitude and Period
Loading the math board and drawing, please wait…
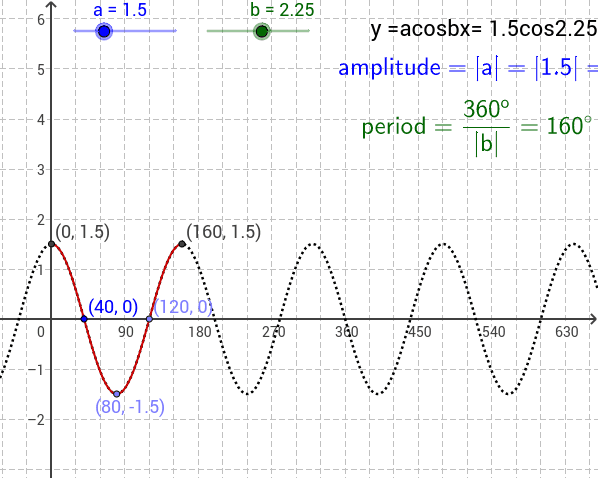
This GeoGebra example demonstrates the graphs of cosine functions under varying amplitude and period, showing how parameters transform the base cosine curve. Core mathematical concepts include trigonometric functions, cosine graphs, amplitude, period, and function transformations. The construction uses the GeoGebra Function command to define objects f and g, with parameters a and b controlling amplitude and period respectively; auxiliary points A, B, C, D, E and text labels T1, T2, T3 annotate key features and parameter values. Suitable for high school mathematics classrooms, trigonometry units, and independent inquiry into function graph transformations.
GeoGebra Commands & Parameters
Function(f, 0, 360 / b) → g