
Cosine Function Demo
Loading the math board and drawing, please wait…
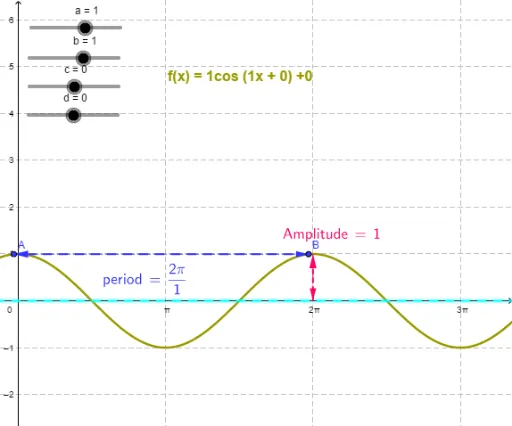
This example demonstrates the cosine function graph, including its amplitude and period. Key math concepts involve trigonometric functions, function graphing, amplitude, and period. GeoGebra commands/objects used include Point, Distance, Vector. Suitable for high school mathematics teaching and function graph learning.
GeoGebra Commands & Parameters
Point(f) → ADistance(A, B) → distanceABVector(A, B) → uVector(B, A) → vDistance(C, D) → distanceCDVector(C, D) → wVector(D, C) → z
AI Drawing Prompt Reference
Draw the graph of a cosine function, highlighting its amplitude and period. Start by plotting the cosine curve and marking a point on it. Then calculate the distance between this point and another, and create vectors based on these two points. Next, identify two more points, calculate the distance between them, and form vectors accordingly. Finally, use these points and vectors to illustrate the concepts of amplitude and period of the function.
The prompt above was compiled from the original drawing commands and is for reference only.