
Correlation Coefficient Demo: Scatter Plot Exploration with PMCC Command
Loading the math board and drawing, please wait…
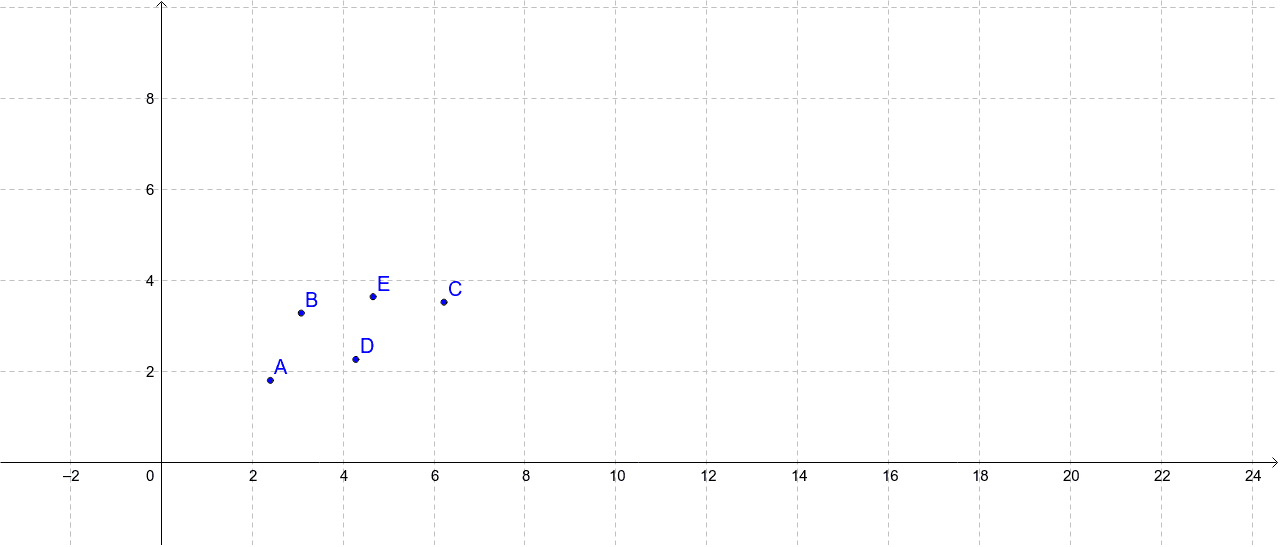
This GeoGebra example demonstrates the linear correlation phenomenon between a set of scatter points (A, B, C, D, E) and a fitted line (a) in the coordinate plane, using the PMCC command to compute and display Pearson’s product-moment correlation coefficient in real time. Core mathematical concepts covered include probability and statistics, correlation coefficient, scatter plots, linear association strength, least-squares regression, and analytic geometry relationships between points and lines. Construction highlights: the example employs the GeoGebra PMCC command along with five free points A–E, a line a, and a text object text1, allowing users to drag points and observe dynamic changes in the correlation coefficient. It is suitable for high school statistics courses or introductory college statistics, ideal for classroom demonstrations and student inquiry to help learners build an intuitive connection between data distribution and correlation.
GeoGebra Commands & Parameters
PMCC({A, B, C, D, E}) → a
AI Drawing Prompt Reference
Draw five free points A, B, C, D, E and a fitted line a on a coordinate plane. Users can drag the points to observe changes in their correlation with the line. A text object text1 should be included to indicate the current state. The focus is on showing the dynamic relationship between scatter plots and linear regression lines to help understand the connection between data distribution and correlation.
The prompt above was compiled from the original drawing commands and is for reference only.