
Correlation Coefficient Demonstration by user5166
Loading the math board and drawing, please wait…
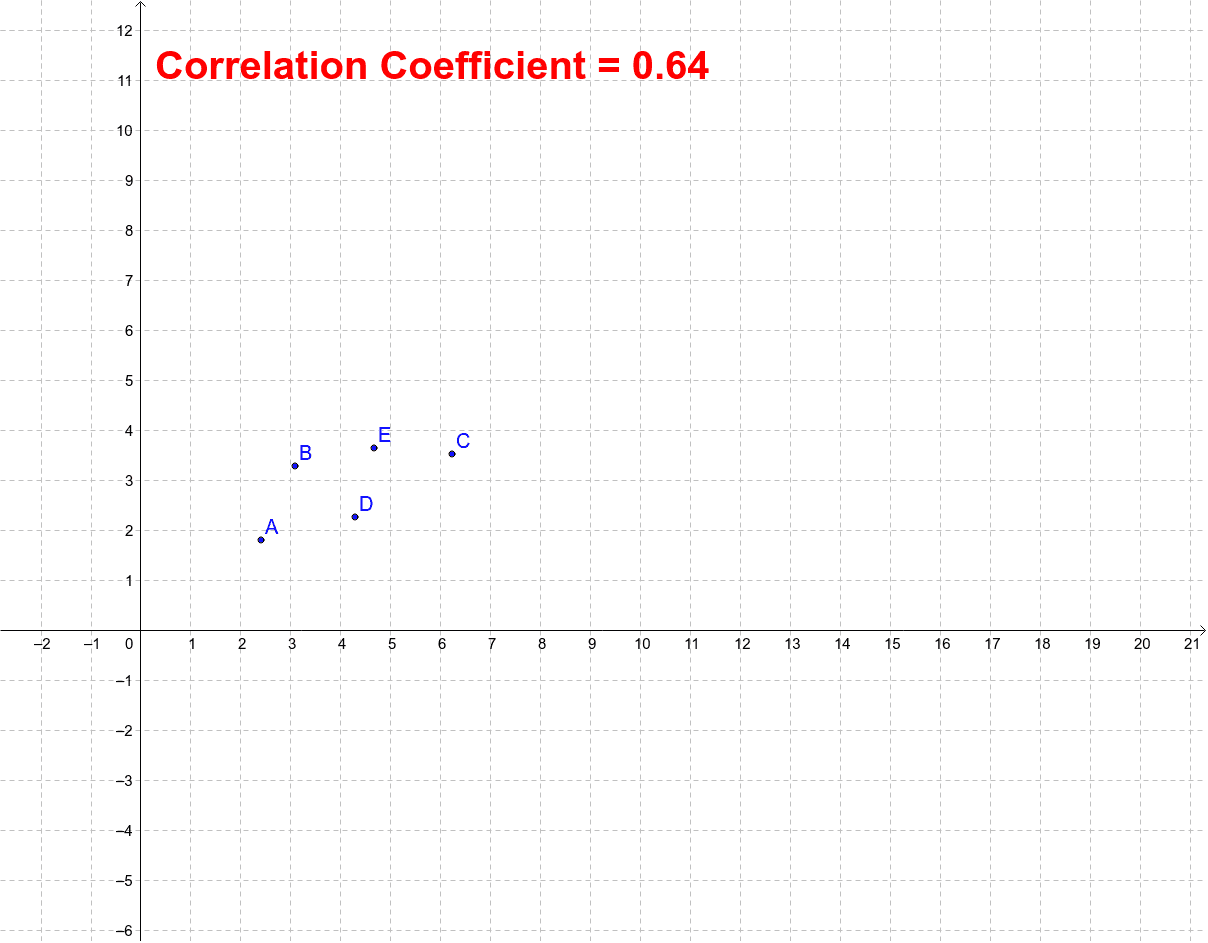
This example demonstrates the correlation coefficient by moving points. The correlation coefficient measures the strength of the linear relationship between two variables. Using the command PMCC, we can see how to calculate and display the correlation between two variables. Suitable for high school and above students learning statistics and data analysis.
GeoGebra Commands & Parameters
PMCC({A, B, C, D, E}) → a
AI Drawing Prompt Reference
Create a scatter plot and demonstrate the strength of the linear relationship between two variables by moving points. Use the PMCC command to calculate and display the correlation coefficient between these two variables.
The prompt above was compiled from the original drawing commands and is for reference only.