
Correlation Coefficient and Line of Best Fit
Loading the math board and drawing, please wait…
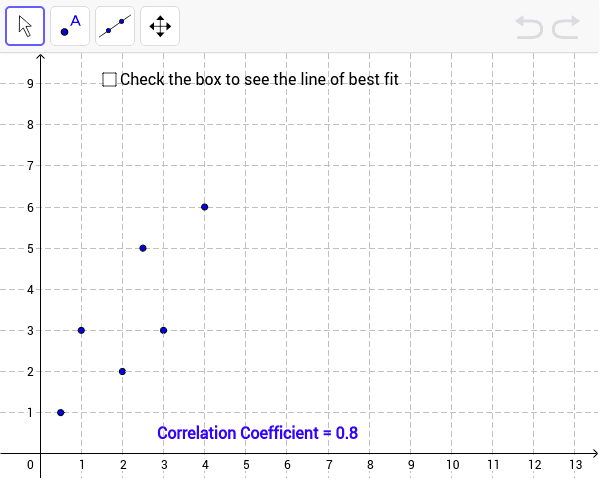
This example demonstrates calculating the correlation coefficient by moving points and displaying the line of best fit with its equation. Core math concepts include correlation, linear regression, and best fit line. Constructed using GeoGebra commands PMCC and FitLineY with objects F, E, D, C, B, A, list1, r, text1, a, b. Suitable for high school mathematics teaching to understand data fitting and statistical concepts.
GeoGebra Commands & Parameters
PMCC(list1) → rFitLineY(list1) → a
AI Drawing Prompt Reference
Create a scatter plot showing the distribution of data points, calculate and display the correlation coefficient and the line of best fit with its equation. Allow dynamic updates to the correlation coefficient and the best fit line as the points are moved, and label the correlation coefficient value and the coefficients of the fit line equation.
The prompt above was compiled from the original drawing commands and is for reference only.