
Correlation and Relationship Type
Loading the math board and drawing, please wait…
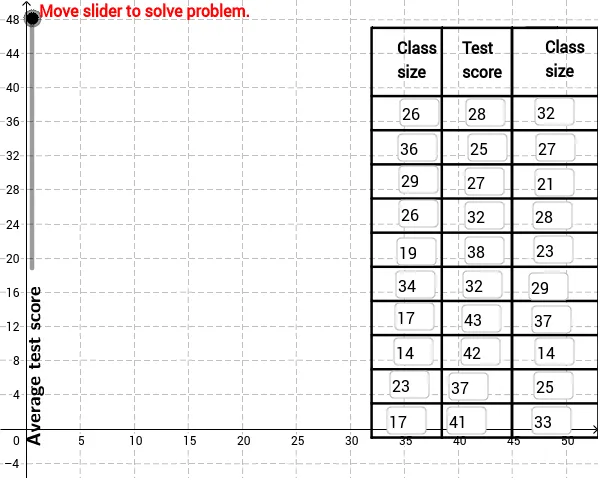
This example demonstrates how to use the correlation coefficient to describe the strength of the relationship between data by plotting points and fitting a line. Core math concepts include the Pearson correlation coefficient (PMCC), linear regression (FitLineY), mean and median lines, area and difference, slope, and straight-line equations. Construction highlights from the summary involve FitLineY for line fitting, PMCC for correlation calculation, Textfield for text display, If for conditional logic, Segment for line drawing, RotateText for text rotation, and Sequence for creating sequences. Suitable for high school mathematics education to understand statistical significance in data distribution and linear relationships.
GeoGebra Commands & Parameters
FitLineY(PointList1) → LineFitPMCC(PointList1) → CorCoeffTextfield(A2) → InA2Textfield(A3) → InA3Textfield(A4) → InA4Textfield(A5) → InA5Textfield(A6) → InA6Textfield(A7) → InA7Textfield(A8) → InA8Textfield(A9) → InA9Textfield(A10) → InA10Textfield(A11) → InA11Textfield(A12) → InA12Textfield(A13) → InA13Textfield(A14) → InA14Textfield(A15) → InA15Textfield(A16) → InA16Textfield(A17) → InA17Textfield(A18) → InA18Textfield(A19) → InA19Textfield(A20) → InA20Textfield(A21) → InA21Textfield(B2) → InB2Textfield(B3) → InB3Textfield(B4) → InB4Textfield(B5) → InB5Textfield(B6) → InB6Textfield(B7) → InB7Textfield(B8) → InB8Textfield(B9) → InB9Textfield(B10) → InB10Textfield(B11) → InB11Textfield(B12) → InB12Textfield(B13) → InB13Textfield(B14) → InB14Textfield(B15) → InB15Textfield(B16) → InB16Textfield(B17) → InB17Textfield(B18) → InB18Textfield(B19) → InB19Textfield(B20) → InB20Textfield(B21) → InB21If(CorVisible, "Hide Correlation Coefficient", "Show Correlation Coefficient") → CorButtonIf(LineVisible, "Hide Best Fit Line", "Show Best Fit Line") → LineButtonSegment((46.33333333333334, 47), (61.33333333333334, 47)) → top2RotateText("Average test score", 90*°) → SideLegendSegment((32.148141111111116, 46.99150524799243), (49.148141111111116, 46.99150524799243)) → top1Sequence(Segment[(32 + 6.5 * i, -1), (32 + 6.5 * i, 47)], i, 0, 2) → Linesv1Sequence(Segment[(45, -1 + 4 * i), (62.4, -1 + 4 * i)], i, 0, 10) → Linesh2Sequence(Segment[(45 + 8 * i, -1), (45 + 8 * i, 47)], i, 0, 2) → Linesv2Sequence(Segment[(32, -1 + 4 * i), (45, -1 + 4 * i)], i, 0, 10) → Linesh1
AI Drawing Prompt Reference
Create a scatter plot with data points and fit a line to show the best fit. Calculate and display the Pearson correlation coefficient. Add horizontal lines above the plot to indicate the average score and label statistical information like the correlation coefficient and regression line equation. Use different colors for data points and the fitted line, and include buttons to toggle the visibility of the correlation coefficient and the best fit line.
The prompt above was compiled from the original drawing commands and is for reference only.