
Correlation and Causation Analysis
Loading the math board and drawing, please wait…
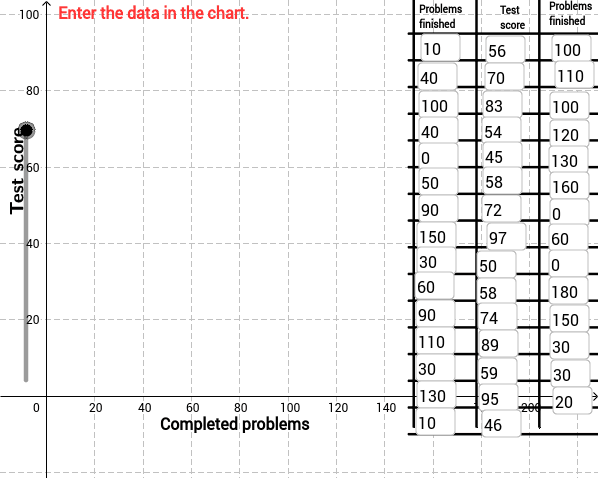
This GeoGebra example demonstrates how to analyze the correlation between two events and determine if a causal relationship exists. Key mathematical concepts include the Pearson correlation coefficient (PMCC), linear regression (FitLineY command), and the distinction between correlation and causation in statistics. The construction involves commands such as FitLineY for line fitting, PMCC for correlation calculation, Textfield for annotations, Polygon and Segment for geometric visualization, RotateText for labels, and Sequence for data generation; objects like points A30, B30, etc., represent data coordinates. It is suitable for high school or introductory college statistics courses, providing an interactive approach to understanding these concepts.
GeoGebra Commands & Parameters
FitLineY(PointList1) → LineFitPMCC(PointList1) → CorCoeffTextfield(A2) → InA2Textfield(A3) → InA3Textfield(A4) → InA4Textfield(A5) → InA5Textfield(A6) → InA6Textfield(A7) → InA7Textfield(A8) → InA8Textfield(A9) → InA9Textfield(A10) → InA10Textfield(A11) → InA11Textfield(A12) → InA12Textfield(A13) → InA13Textfield(A14) → InA14Textfield(A15) → InA15Textfield(A16) → InA16Textfield(A17) → InA17Textfield(A18) → InA18Textfield(A19) → InA19Textfield(A20) → InA20Textfield(A21) → InA21Textfield(B2) → InB2Textfield(B3) → InB3Textfield(B4) → InB4Textfield(B5) → InB5Textfield(B6) → InB6Textfield(B7) → InB7Textfield(B8) → InB8Textfield(B9) → InB9Textfield(B10) → InB10Textfield(B11) → InB11Textfield(B12) → InB12Textfield(B13) → InB13Textfield(B14) → InB14Textfield(B15) → InB15Textfield(B16) → InB16Textfield(B17) → InB17Textfield(B18) → InB18Textfield(B19) → InB19Textfield(B20) → InB20Textfield(B21) → InB21Polygon((190, y(Corner[1])), Corner[2], Corner[3], (190, y(Corner[4]))) → poly1, a, b, c, dTextfield(A22) → InA22Textfield(A23) → InA23Textfield(A24) → InA24Textfield(A25) → InA25Textfield(A26) → InA26Textfield(B22) → InB22Textfield(B23) → InB23Textfield(B24) → InB24Textfield(B25) → InB25Textfield(B26) → InB26Textfield(A27) → InA27Textfield(A28) → InA28Textfield(A29) → InA29Textfield(A30) → InA30Textfield(B27) → InB27Textfield(B28) → InB28Textfield(B29) → InB29Textfield(B30) → InB30Segment((195, 109), (331, 109)) → top1RotateText("Test score", 90*°) → SideLegendSequence(Segment[(150, -10 + 7 * i), (308, -10 + 7 * i)], i, 0, 15) → Linesh1Sequence(Segment[(178 + 26 * i, -8), (178 + 26 * i, 107)], i, -1, 4) → Linesv1
AI Drawing Prompt Reference
Create a chart to analyze the correlation between two events and determine if a causal relationship exists, showing data points and a fitted line, calculate and label the Pearson correlation coefficient, use polygons and segments to visualize the data, add text annotations for statistical concepts and results, suitable for statistics education.
The prompt above was compiled from the original drawing commands and is for reference only.