
Coronavirus 2020: Exponential Growth (Copy)
Loading the math board and drawing, please wait…
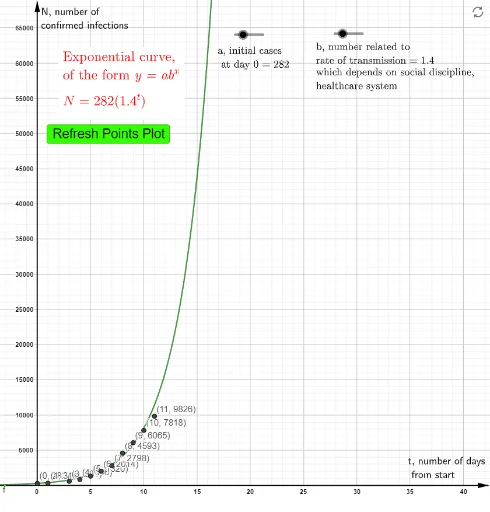
①This GeoGebra example demonstrates the exponential growth of COVID-19 (2019-nCoV) cases in early 2020, using a simple exponential model to fit real outbreak data. ②The core mathematical concept is the exponential function, focusing on how the base parameter affects growth rate, the shape of the curve, and the comparison between exponential and linear growth. ③Construction details: The model uses multiple point objects (A1-A12, B1-B12, etc.) representing daily case counts, sliders (a, b) to adjust the exponential function f, text objects (Text3, Text4) for labels, a button (button1) for interactive control, and auxiliary points (P1-P7). The graph combines the function curve with scattered data points for visual comparison. ④This resource is suitable for high school or introductory college mathematics courses, particularly for teaching exponential functions, data fitting, and real-world applications, as well as for public health education to illustrate the mathematical basis of epidemic spread.
GeoGebra Commands & Parameters
Numeric b(1.4)Numeric a(282)012345678910112823145818461320201427984593606578189826f(t) = If[-14 ≤ t ≤ 100, (a * b^(t))]Numeric a_1(1.4190675485932571)Numeric B3(NaN)(A1, B1)(A2, B2)(A3, B3)(A4, B4)(A5, B5)(A6, B6)(A7, B7)(A8, B8)(A9, B9)(A10, B10)(A11, B11)(A12, B12)Numeric A15(NaN)Numeric B15(NaN)(A15, B15)Numeric A16(NaN)Numeric B16(NaN)(A16, B16)Numeric A17(NaN)Numeric B17(NaN)(A17, B17)Numeric A18(NaN)Numeric B18(NaN)(A18, B18)Numeric A19(NaN)Numeric B19(NaN)(A19, B19)Numeric A20(NaN)Numeric B20(NaN)(A20, B20)Numeric A21(NaN)Numeric B21(NaN)