
Coordinate Geometry & Function Demonstration
Loading the math board and drawing, please wait…
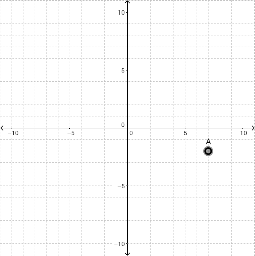
This example demonstrates point locus, slider animation, and function graphing in coordinate geometry; involves core concepts like coordinate geometry, geometric construction, function graphs (geometric distribution, boxplot, logarithmic functions), natural numbers, and hyperbola; construction highlights include GeoGebra objects A, B for point definition, trace for locus tracking, and A_1 for auxiliary construction; suitable for high school and above mathematics learning to understand dynamic changes in function-geometry relationships.
GeoGebra Commands & Parameters
Point A(7, -2)((2 * x(A)), 0)Boolean trace(false)A + (0, 2)