
Continuous Variable Probability Function Demo
Loading the math board and drawing, please wait…
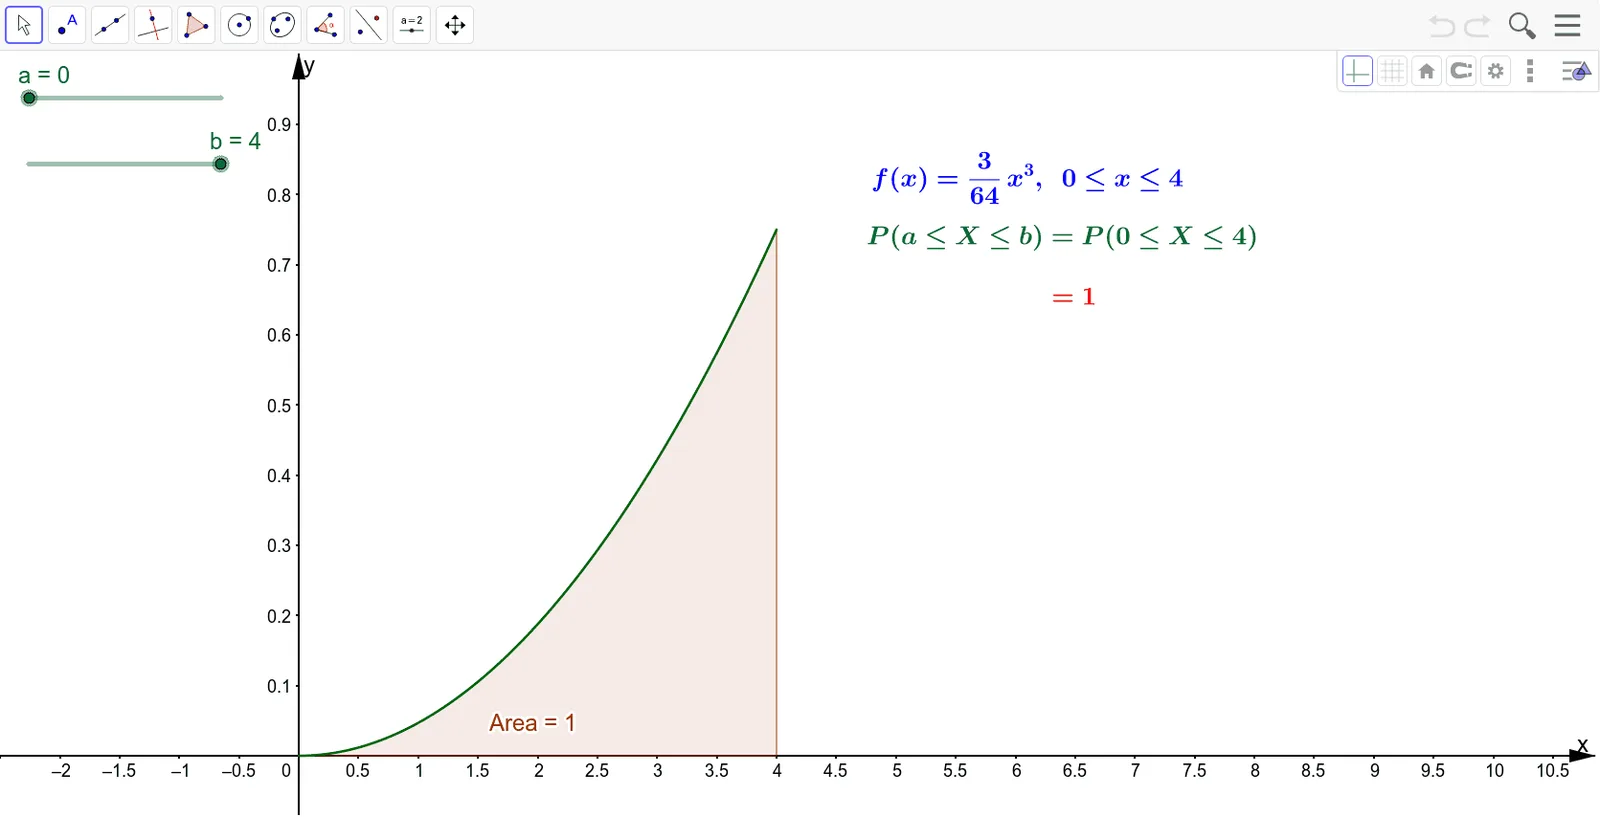
This example demonstrates the calculation and area representation of a continuous variable probability density function through integration. Key math concepts include probability density functions, integration, and geometric interpretation. GeoGebra commands used are Integral to compute the definite integral of function f over interval [a,b], displaying the result Area, with text objects text1, text2, text3 labeling the process and outcome. Suitable for high school and above students learning probability statistics and calculus for teaching and concept understanding.
GeoGebra Commands & Parameters
Integral(f, a, b) → Area
AI Drawing Prompt Reference
Draw a graph of a continuous variable probability density function, showing the calculation and area representation of probability through integration, including the function curve, the integral interval [a,b], and the calculated area, with text explaining the process and results, start by drawing the function curve and interval, then label the integral area and text explanations.
The prompt above was compiled from the original drawing commands and is for reference only.