
Continuous Uniform Distribution Probability Calculation
Loading the math board and drawing, please wait…
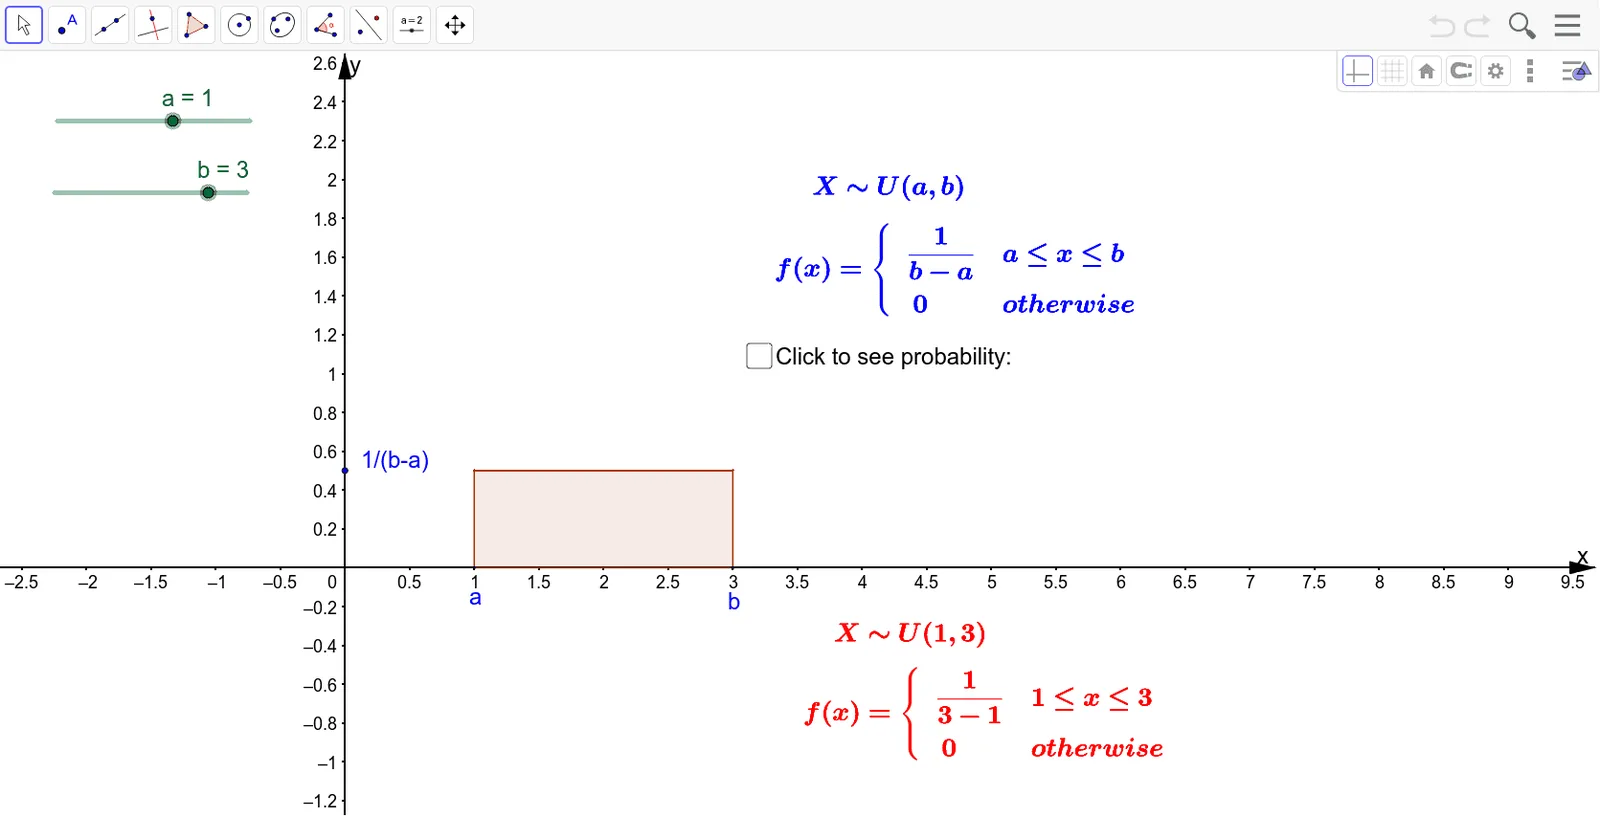
This example demonstrates how to use GeoGebra to plot the probability density function of a continuous uniform distribution and calculate probabilities over specified intervals. Key math concepts include continuous uniform distribution, probability density function, and definite integral. Construction highlights involve commands like Polygon and Integral, utilizing objects such as a, b, A, B, g, f, r, C, D, E, Area_1, a_1, b_1, q, p, text elements, and more. Suitable for high school and above students learning probability calculations.
GeoGebra Commands & Parameters
Polygon(A, B, E, D) → Area_1, a_1, b_1, q, pIntegral(f, c, d) → Area