
Continuous Probability Density Function Visualization
Loading the math board and drawing, please wait…
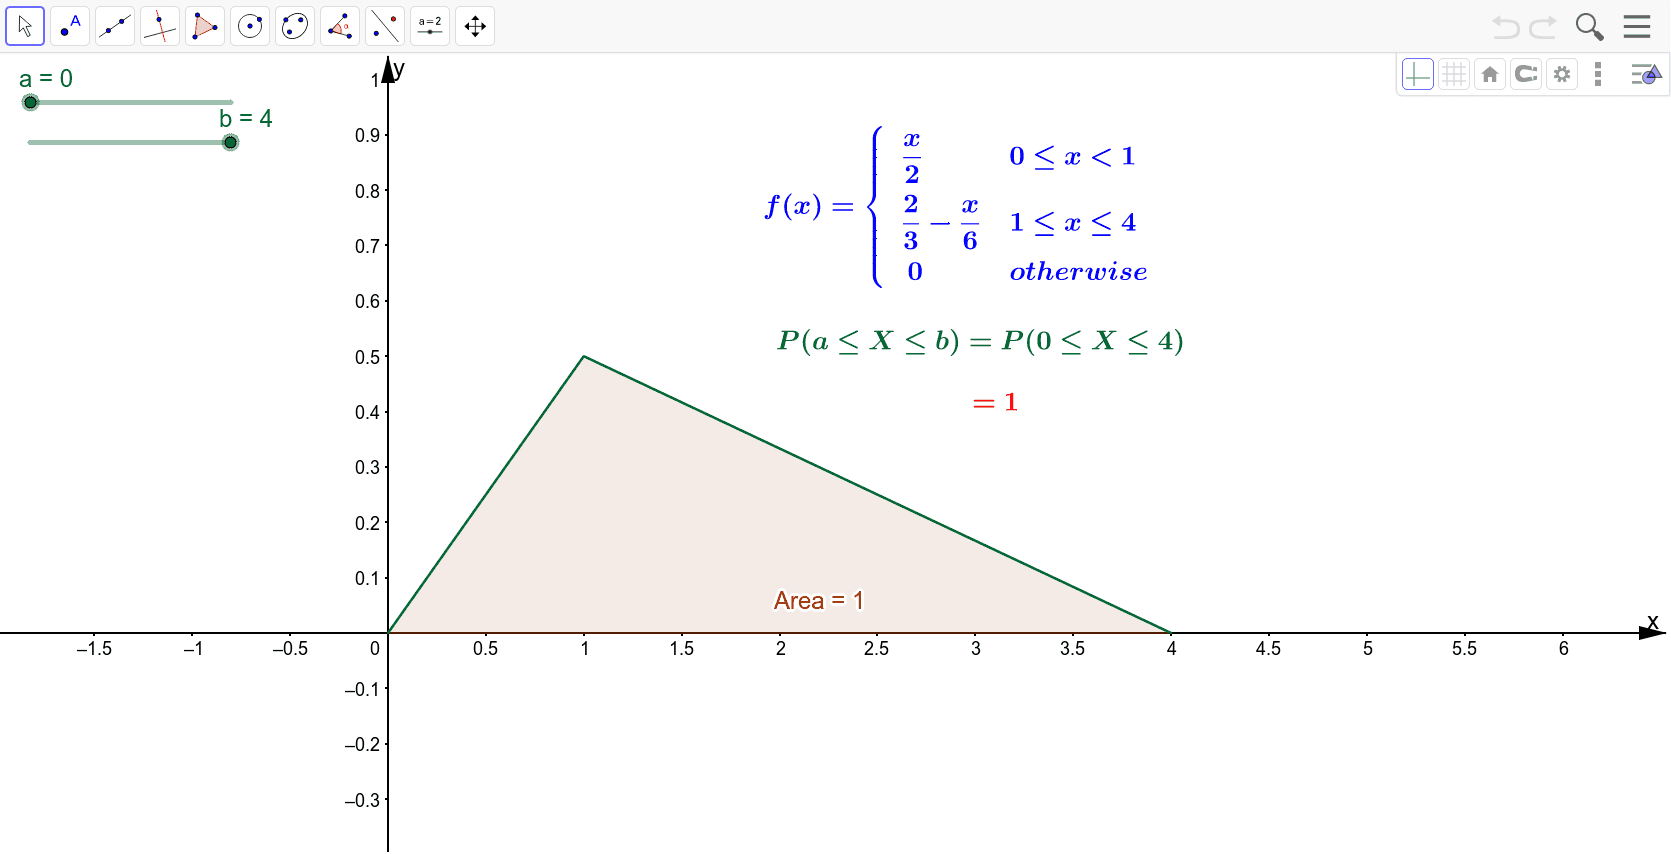
This GeoGebra example dynamically visualizes a continuous probability density function (PDF) and its integral area, demonstrating that the area under the PDF curve over an interval equals the probability of that interval. Core mathematical concepts include probability density functions, definite integrals, interval probability, confidence intervals, and the relationship between area under a curve and probability. The construction uses GeoGebra's Integral command to compute the definite integral of function f over [a,b], generating an area region 'Area', along with text objects text1, text2, text3 that dynamically display the integral value, probability, and parameter explanations. Users can adjust parameters a, b and functions j, g, f via sliders or input to observe how the shaded area changes. This example is suitable for high school and introductory college students learning probability and statistics or calculus, helping them understand continuous random variable probability calculations, properties of PDFs, and the application of integration in probability. It serves well for classroom demonstrations and self-directed exploration.
GeoGebra Commands & Parameters
Integral(f, a, b) → Area
AI Drawing Prompt Reference
Visualize a continuous probability density function with its integral area, showing that the area under the curve over an interval [a,b] equals the probability of that interval. Include dynamic text displaying the integral value, probability, and parameter explanations, allowing users to adjust parameters a, b to see how the shaded area changes.
The prompt above was compiled from the original drawing commands and is for reference only.