
Continuous Probability Density Function Demo
Loading the math board and drawing, please wait…
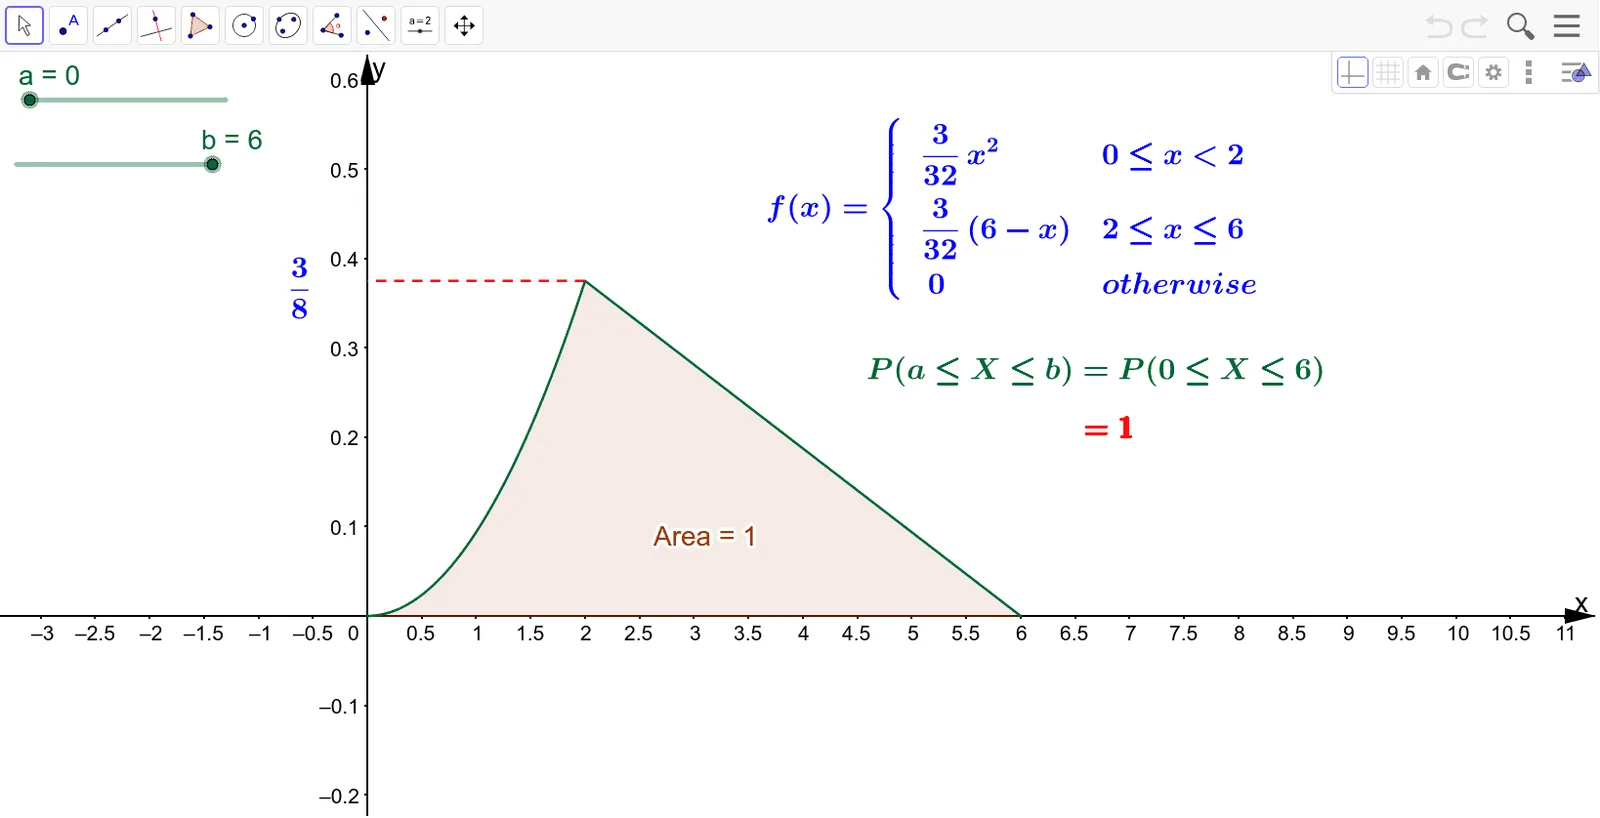
This example demonstrates the graph of a continuous probability density function and its integral calculation. Key math concepts include probability density function, upper and lower sums (Riemann sums), indefinite integral, real numbers, geometric mean, Poisson distribution. GeoGebra commands used are Integral and Segment; objects include f, g, h, a, b, Area, text1, A, B, i, text3, text2, text4. Suitable for high school and above students to understand the integration of probability statistics and calculus.
GeoGebra Commands & Parameters
Integral(h, a, b) → AreaSegment(A, B) → i
AI Drawing Prompt Reference
Draw the graph of a continuous probability density function and show its integral calculation. Include the function curve, integral area, and upper and lower sums. First, plot the function curve, then mark the upper and lower limits of the integral and calculate the integral area. Connect the endpoints of the integral area with a line segment to form a geometric representation. Finally, add text annotations to explain the concepts of probability density function, integral, upper and lower sums.
The prompt above was compiled from the original drawing commands and is for reference only.