
Continuity Questions: Investigating Continuity of a Function at x = a
Loading the math board and drawing, please wait…
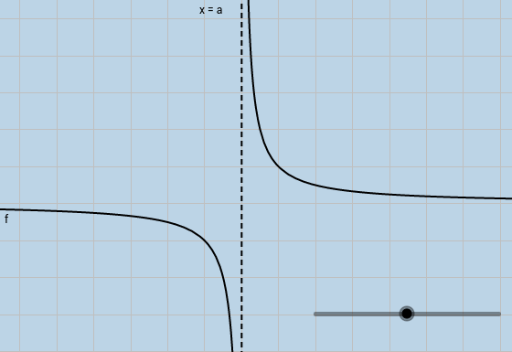
This GeoGebra example presents an interactive exploration of the continuity of a function f at a specific input x = a. It visually demonstrates the concept by allowing users to manipulate the point a and observe the behavior of the function graph around that point. Core mathematical concepts include limits, the formal definition of continuity (left-hand limit, right-hand limit, and function value all equal), and types of discontinuities. The construction uses GeoGebra objects: a (a movable point or slider), f (the main function), and g (possibly an auxiliary function for comparison). By dragging a, students can test whether the function is continuous at that point, reinforcing the connection between graphical intuition and rigorous definitions. This resource is suitable for high school or introductory college calculus courses, serving as a classroom demonstration, self-study tool, or formative assessment for understanding continuity.
GeoGebra Commands & Parameters
Numeric a(0)f(x) = 1 / (x - a)x = a
AI Drawing Prompt Reference
Draw a function graph where the function value changes as a movable point is adjusted, showing how the graph behaves as the point moves. Include a draggable point and a curve representing the function to observe continuity changes as the point moves, and the relationship between left-hand and right-hand limits and the function value at that point, for understanding the concept of continuity at a point.
The prompt above was compiled from the original drawing commands and is for reference only.