
Continuity Condition Demonstration
Loading the math board and drawing, please wait…
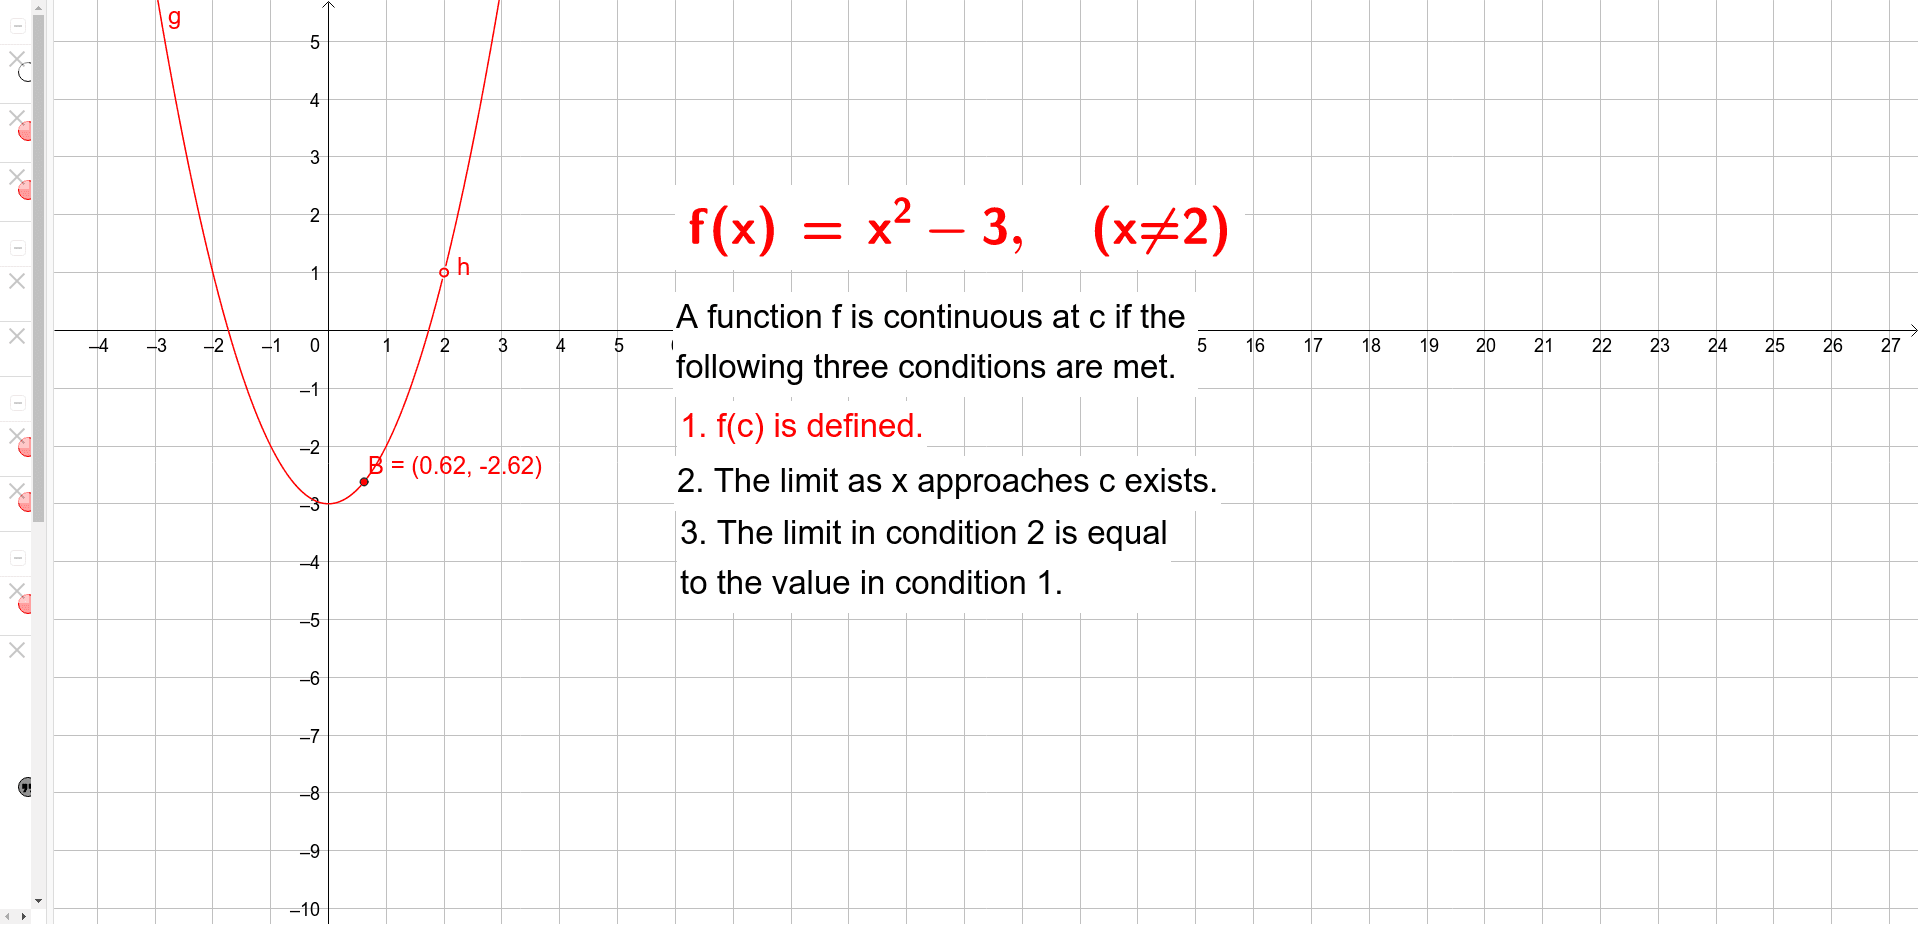
This example demonstrates the continuity condition at a specific point a, visually showing the relationship between function values, left-hand and right-hand limits, and the function graph. It involves core mathematical concepts such as continuity definition, limits, exponential functions, interest calculation, translation, square operations, and multiplication. The construction uses GeoGebra commands like LaTeX, Point, and objects including f, a, b, text1, A, g, h, B, and multiple text objects (text2 series). Suitable for high school and above learners to understand the geometric meaning and computational applications of continuity and limits.
GeoGebra Commands & Parameters
LaTeX(f, true, true) → text1Point({2, 1}) → APoint(f) → B
AI Drawing Prompt Reference
Draw a graph demonstrating the continuity condition of a function, including a function plot and two points, one on the graph and one at a fixed position, with the function expression and key points labeled to visually show the relationship between function values, left-hand and right-hand limits, and the graph.
The prompt above was compiled from the original drawing commands and is for reference only.