
Contingency Table & Chi‑Square Test of Pet Preferences by Grade
Loading the math board and drawing, please wait…
In collections
CCSS IP Math I Unit 4 Lesson 2
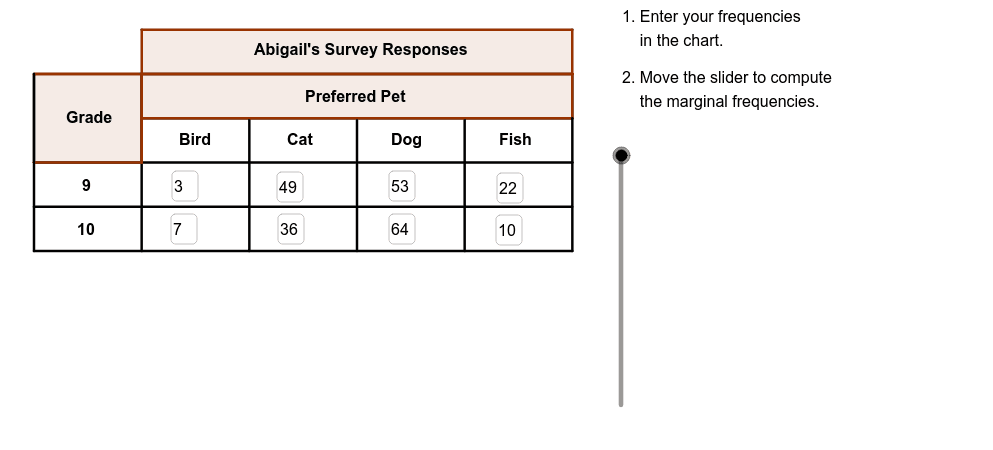
① This example demonstrates how to display a contingency table of student pet preferences (bird, cat, dog, fish) across two grades and perform a chi‑square test of independence. ② Core mathematical concepts: contingency table construction, frequency counts, chi‑square statistic computation, hypothesis testing and confidence intervals. ③ Construction highlights: Textfield for data entry, Segment and Polygon to draw grouped bar segments, Vector for annotation; objects include per‑grade per‑pet count points (e.g., bird9, cat10), summary objects (SumBirdB, etc.), and grade labels (Grade, Grade9, Grade10). ④ Suitable for high‑school statistics and probability courses, introductory college statistics, and as a teaching resource for data visualization and hypothesis testing.
GeoGebra Commands & Parameters
Textfield(B3) → bird9Textfield(B4) → bird10Textfield(C3) → cat9Textfield(C4) → cat10Textfield(D3) → dog9Textfield(D4) → dog10Textfield(E3) → fish9Textfield(E4) → fish10Segment(C, D) → bSegment(E, F) → cSegment(G, H) → dSegment(I, J) → eSegment(A, M) → gSegment(N, K) → hSegment(M, K) → iSegment(O, P) → jSegment(Q, R) → kSegment(S, T) → lSegment(B, L) → mPolygon(C, N, K, M) → poly1, n, p, q, rPolygon(C, U, O, A) → GradePoly, s, t, a_1, b_1Segment(A, S) → aSegment(K, T) → fPolygon(S, B, V, D) → poly2, s_1, b_2, v, d_1Polygon(F, A1, W, H) → poly3, f_1, a1, w, h_1Polygon(Z, L, T, J) → poly4, z, l_1, t_1, j_1Vector(A_1, B_1) → uVector(C_1, D_1) → u_1Vector(E_1, F_1) → v_1Vector(G_1, H_1) → w_1Polygon(I_1, M_1, M, L_1) → Title, c_1, e_1, g_1, i_1
AI Drawing Prompt Reference
Create a contingency table showing student pet preferences across two grades, with categories for birds, cats, dogs, and fish. Add text fields for entering the count of each pet per grade. Draw grouped bar charts by constructing horizontal and vertical segments and filling polygons to represent each bar. Include grade labels and a title for the chart. Use vectors to annotate key data points and highlight results. The layout should clearly display the frequency counts, allow easy data entry, and present the chi‑square test visualization for statistical analysis.
The prompt above was compiled from the original drawing commands and is for reference only.