
Cone Unrolled: Geometric and Functional Visualization
Loading the math board and drawing, please wait…
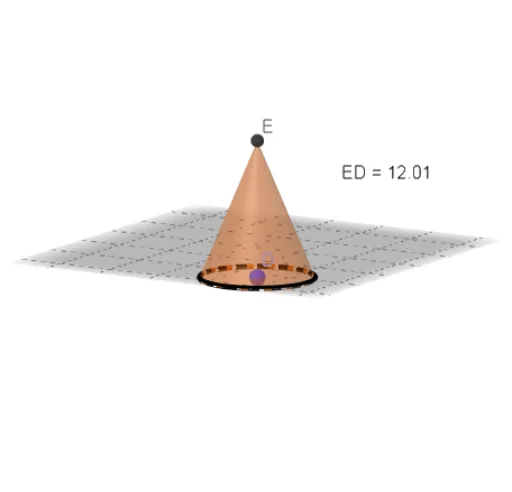
This example demonstrates the unfolded form of a cone, illustrating the relationship between cone geometry and function graphs. Key mathematical concepts include cone unfolding, sector area calculation, and parameter effects on the shape. Construction involves GeoGebra commands such as Circle, Rotate, Segment, and CircleArc to create the cone, with adjustable parameters α and radius to observe changes. Suitable for high school students or college freshmen learning solid geometry and function graphing.
GeoGebra Commands & Parameters
Circle(A, B) → cRotate(C, α / 2, A) → C'Rotate(C, (-(α / 2)), A) → C'_1Segment(C'_1, A) → fSegment(A, C') → gCircleArc(A, C', C'_1) → dOrthogonalLine(D, xOyPlane) → hCircleSector(A, C', C'_1) → pDistance(E, D) → distanceEDCone(D, E, sqrt(radius^(2) - a^(2))) → k, k_2, k_3Circle(D, sqrt(radius^(2) - a^(2)), xOyPlane) → e
AI Drawing Prompt Reference
Draw an unfolded cone diagram to show the relationship between cone geometry and function graphs. Include a sector, a circle, and the lateral surface of the cone. Adjust the sector angle and radius to observe shape changes. Ensure the diagram is clear and labeled to help understand geometric relationships.
The prompt above was compiled from the original drawing commands and is for reference only.