
Computing Not So Basic Probabilities from Tables
Loading the math board and drawing, please wait…
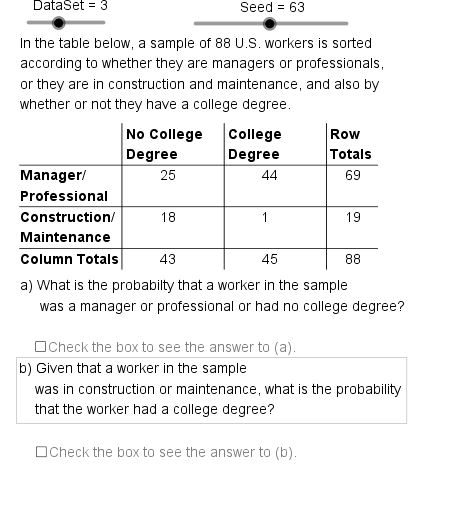
This example demonstrates calculating not-so-basic probabilities from tables. It covers conditional probability calculations. GeoGebra commands used include Element, Min, Mod, Segment, If, and Append. Suitable for high school math education, helping students understand basic concepts and calculations in probability and statistics.
GeoGebra Commands & Parameters
Element(Pr12Sq, DataSet) → Pr12Element(Pr22Sq, DataSet) → Pr22Element(Pr21Sq, DataSet) → Pr21Element(Pr11Sq, DataSet) → Pr11Min({Pr11, Pr12, Pr21, Pr22}) → PrMinMod(SlNm2, 2) → BOpElement(DDSq, DataSet) → DD0Element(RL1Sq, DataSet) → RL1Element(RL2Sq, DataSet) → RL2Element(CL1Sq, DataSet) → CL1Element(CL2Sq, DataSet) → CL2Segment((TbLf, TbTp - TbCH), (TbLf + (3.5 * TbCW), TbTp - TbCH)) → htpSegment((TbLf, TbTp - (2 * TbCH)), (TbLf + (3.5 * TbCW), TbTp - (2 * TbCH))) → hmdSegment((TbLf, TbTp - (3 * TbCH)), (TbLf + (3.5 * TbCW), TbTp - (3 * TbCH))) → hbmSegment((TbCW, TbTp), (TbCW, TbTp - (3.5 * TbCH))) → vlfSegment(((2 * TbCW), TbTp), ((2 * TbCW), TbTp - (3.5 * TbCH))) → vmdSegment(((3 * TbCW), TbTp), ((3 * TbCW), TbTp - (3.5 * TbCH))) → vrgElement(IndSq, DataSet) → IndElement(Rw1OpSq, DataSet) → Op1Element(Rw2OpSq, DataSet) → Op2Element(Cl1OpSq, DataSet) → Op3Element(Cl2OpSq, DataSet) → Op4If(OpBNm1 > 2, OpBNm2, OpBNm2 + 2) → OpBNm3Element(OpSq, OpANm1) → OpA1Element(OpSq, OpANm2 + 2) → OpA2Element(OpSq, OpBNm1) → OpC1Element(OpSq, OpBNm3) → OpC2Element(TbRCSq, OpANm1) → TbRwElement(TbRCSq, OpBNm1) → CndRCElement(CndRC, OpBNm2) → BNumElement(RCTtSq, OpBNm1) → BDnmAppend(TbRw, Element[Element[TbRCSq, OpANm3], OpANm2]) → OpASqElement(OpASq, 1) → ANm1Element(OpASq, 2) → ANm2Element(OpASq, 3) → ANm3If(DataSet ≟ 1, "an", "a") → IA
AI Drawing Prompt Reference
Draw a table with two conditional probabilities and four event probability values. First, draw the table borders, then fill each cell with event names, probability values, and conditional probabilities. Finally, calculate the minimum probability value based on the given dataset and display it in the table. Ensure the table layout is clear, and each cell's content accurately reflects the given data.
The prompt above was compiled from the original drawing commands and is for reference only.