
Comprehensive Study on Geometric Construction and Statistical Characteristics
Loading the math board and drawing, please wait…
In collections
Dynamic Geometry Study Tasks
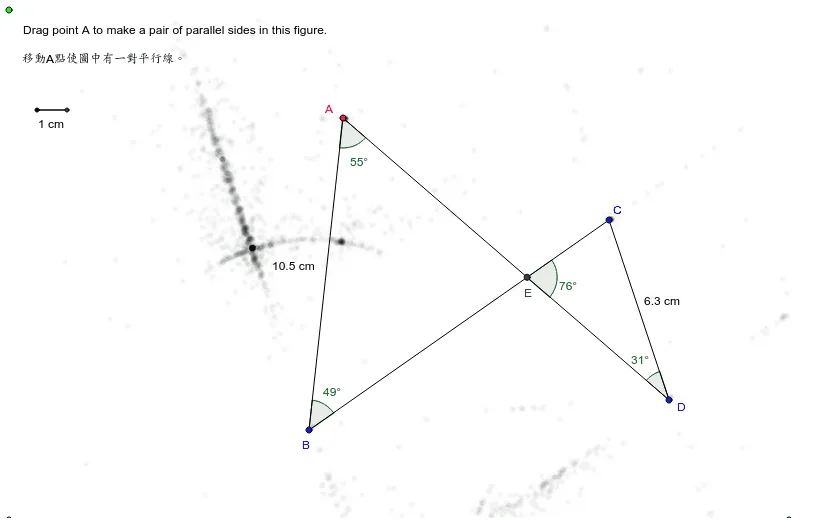
This example demonstrates the spatial relationship between points, lines, and angles, integrating geometric construction with statistical analysis. It covers core mathematical concepts including angle measurement, straight line properties, power functions, and statistical metrics such as standard deviation. The construction is implemented using GeoGebra commands such as Segment, Angle, Intersect, and Midpoint to create a network of points (A through K) and associated variables (var1-var11) for quantitative analysis. This resource is ideal for high school or early college students studying the intersection of geometry and data analysis.
GeoGebra Commands & Parameters
Segment(A, B) → aSegment(B, C) → bSegment(C, D) → cSegment(D, A) → dAngle(B, A, D) → αAngle(C, B, A) → βIntersect(b, d) → EAngle(D, E, C) → γAngle(C, D, A) → δMidpoint(A, B) → FMidpoint(C, D) → GSegment(H, I) → e
AI Drawing Prompt Reference
Draw a quadrilateral with four vertices connected in order to form four sides. Mark two interior angles at adjacent vertices. Draw the intersection point of the two diagonals. From this intersection, draw lines to adjacent vertices to create two new angles. Mark the midpoints of one pair of opposite sides and connect them with a segment. Finally, draw a separate line segment outside the shape for statistical analysis. The figure includes multiple points, segments, and angles, combining geometric construction with data representation.
The prompt above was compiled from the original drawing commands and is for reference only.