
Compound Interest: Behavior as n Increases
Loading the math board and drawing, please wait…
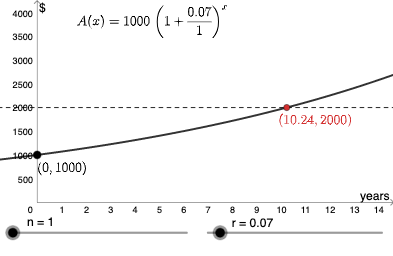
This example demonstrates the behavior of compound interest as the compounding frequency n increases, showing the trend and limit of the compound amount A. Key math concepts include compound interest formula, exponential functions, derivatives, and limits. The construction uses the Intersect command and involves objects like r, n, P, f, A, text1, g, B to dynamically visualize the effect of n on A. Suitable for high school and above students to understand the relationship between compound interest, limits, and derivatives, enhancing comprehension of function graphs and derivative applications.
GeoGebra Commands & Parameters
Intersect(f, g, (10.244768351058712, 2000)) → B
AI Drawing Prompt Reference
Plot the behavior of compound interest as the compounding frequency n increases, showing the trend and limit of the compound amount A. Use the intersect command to find the intersection of functions f and g at point (10.244768351058712, 2000), creating point B, and dynamically visualize the effect of n on A.
The prompt above was compiled from the original drawing commands and is for reference only.