
Comparing Quadratic Graphs
Loading the math board and drawing, please wait…
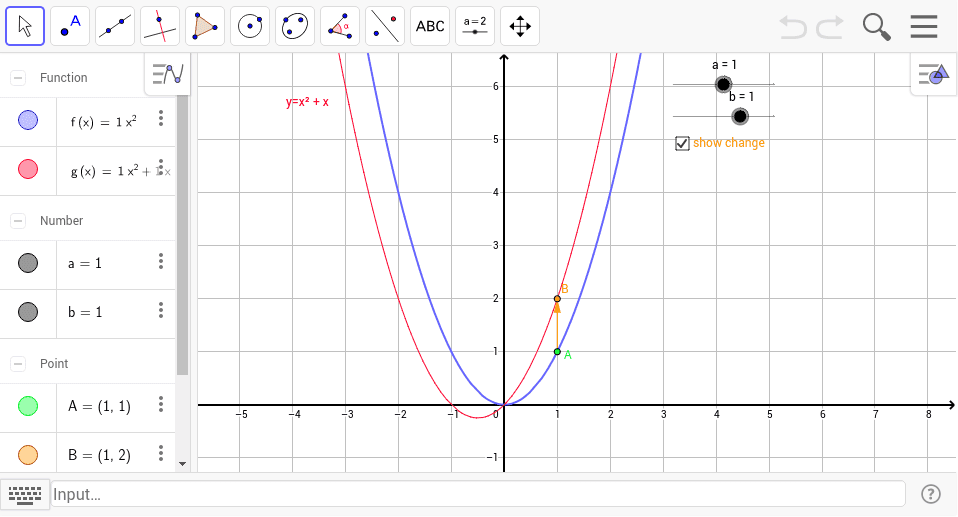
① This example shows how to compare two parabolas in real time by varying the linear coefficient and vertical shift of a quadratic function. ② Core math concepts: standard form of a quadratic, effect of the linear coefficient on the vertex’s horizontal position, and effect of vertical translation on the whole graph. ③ Construction highlights: Point command creates points A and B; Vector command builds vectors u and s; functions f(x)=a x^2+b x and g(x)=f(x)+c are defined; sliders a, b, c (objects a, b, u, s) dynamically control coefficients and shift; text1 displays current parameter values. ④ Suitable for high‑school “Functions and Graphs” lessons, student inquiry, or exam review to visualize how coefficient changes affect parabola geometry.
GeoGebra Commands & Parameters
Point(f) → AVector(A, B) → u
AI Drawing Prompt Reference
Draw two quadratic function graphs to compare them by adjusting the linear coefficient and vertical shift. First, create points A and B, then use vector u to connect A and B.
The prompt above was compiled from the original drawing commands and is for reference only.