
Comparing Polar and Rectangular Coordinates
Loading the math board and drawing, please wait…
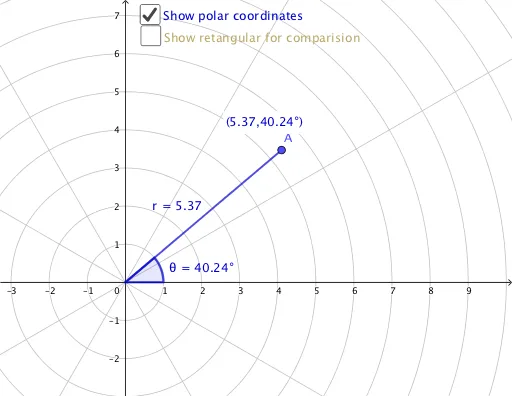
This example demonstrates how to plot polar and rectangular coordinates on the same system, illustrating the conversion between them. Key math concepts include polar-to-rectangular conversion, point representation, and geometric constructions. It uses commands like OrthogonalLine, Intersect, Segment, Point, and Angle in GeoGebra. Suitable for high school students learning coordinate system transformations and for demonstrating calculus and geometric constructions.
GeoGebra Commands & Parameters
OrthogonalLine(A, xAxis) → fIntersect(f, xAxis) → BSegment(A, B) → bIntersect(xAxis, yAxis) → CSegment(C, B) → cPoint(xAxis) → DAngle(D, C, A) → θSegment(C, A) → rPoint(c) → ESegment(E, A) → gAngle(c, g) → αOrthogonalLine(A, xAxis) → iIntersect(i, xAxis) → FSegment(A, F) → jIntersect(r, xAxis) → HSegment(F, H) → k
AI Drawing Prompt Reference
Draw a comparison between polar and rectangular coordinates. Start by drawing the origin O and the x-axis, then draw a line f perpendicular to the x-axis through O, and mark its intersection with the x-axis as point B, connecting OB. Next, draw the intersection point C of the x-axis and y-axis, and connect CB. On the x-axis, mark point D, and draw angle CDA with its measure as θ. Then, draw a line i perpendicular to the x-axis through A, and mark its intersection with the x-axis as point F, connecting AF. Finally, mark the intersection point H of line i and the x-axis, and connect FH.
The prompt above was compiled from the original drawing commands and is for reference only.