
Comparing the Binomial to the Normal Approximation
Loading the math board and drawing, please wait…
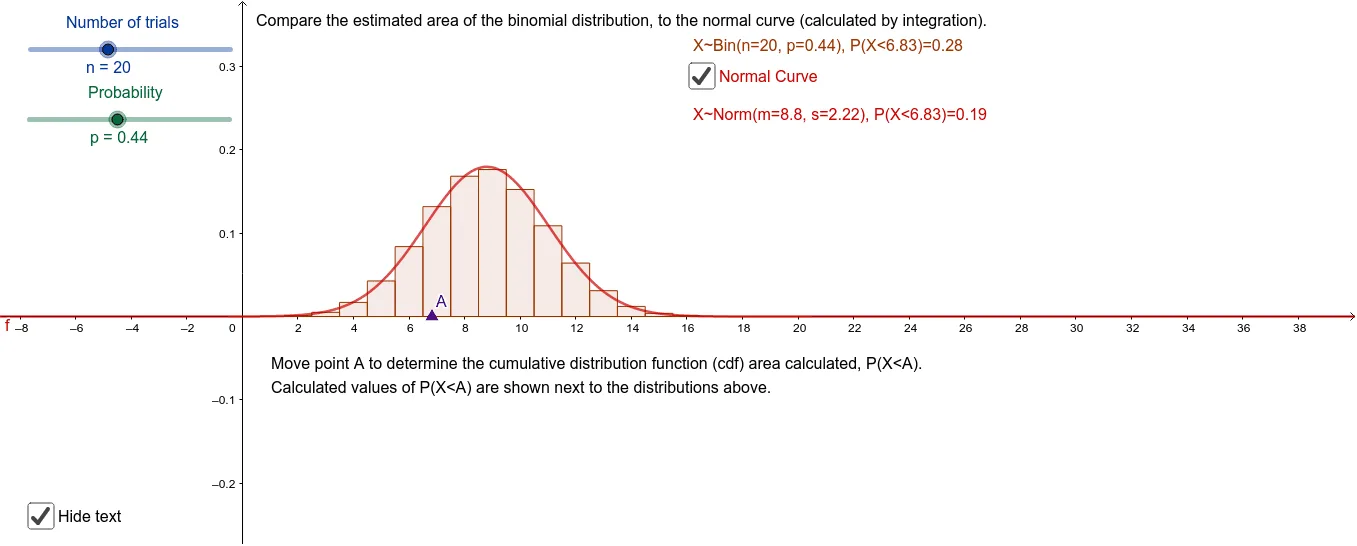
This GeoGebra example dynamically illustrates how the binomial probability mass function approximates the normal density curve as the number of trials increases. Core mathematical concepts include binomial distribution, normal distribution, central limit theorem, and the comparison between discrete probabilities and continuous densities. Construction highlights: the BinomialDist command generates the bar chart for the binomial distribution, the Normal command plots the normal curve, sliders n and p adjust parameters, and Point, Integral, and text objects annotate key values and areas. Suitable for high school or introductory college statistics courses to demonstrate the convergence of binomial to normal and to verify approximation conditions such as np and n(1-p) both greater than 5.
GeoGebra Commands & Parameters
BinomialDist(n, p) → aNormal(m, s, x) → fPoint(xAxis) → ABinomialDist(n, p, x(A), true) → cIntegral(f, 0, x(A)) → d
AI Drawing Prompt Reference
Create a dynamic statistical chart illustrating the convergence of a binomial distribution to a normal distribution. Include a bar chart for the binomial distribution controlled by sliders for the number of trials (n) and success probability (p), and overlay a smooth normal density curve. As n increases, the bars should align closely with the curve. Place a draggable point on the x-axis to mark a specific value, and shade the cumulative area under the binomial bars up to that point as well as the area under the normal curve up to the same x-coordinate, allowing visual comparison of discrete and continuous cumulative probabilities. Add text labels showing the current x-value and corresponding probabilities.
The prompt above was compiled from the original drawing commands and is for reference only.