
Compare Two Linear Functions
Loading the math board and drawing, please wait…
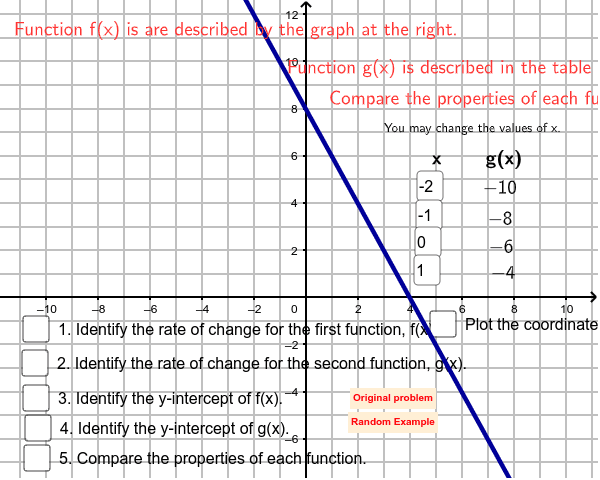
This GeoGebra example demonstrates how to compare the properties of two linear functions: one function, f(x), is represented graphically, while the other, g(x), is displayed in a table. Key mathematical concepts include linear functions, slope, intercept, and the interplay between graphical and tabular representations. The construction employs GeoGebra commands such as Textfield for labels, If for conditional logic, and Random for generating variable inputs; objects like f, g, X1, X2 define functions and points, while state objects manage display changes. It is suitable for high school or middle school mathematics education, aiding students in visualizing and analyzing linear function behaviors.
GeoGebra Commands & Parameters
Textfield(x1) → X1Textfield(x2) → X2Textfield(x3) → X3Textfield(x4) → X4If(bf > 0, "-", "+") → PMfIf(mf > 0, "increasng", "decreasing") → fincdecIf(mg > 0, "increasing", "decreasing") → gincdecrIf(abs(mg) ≟ abs(mf), "equal", "not equal") → EQrIf(bg ≟ bf, "the same", If[bg > bf, "a higher", "a lower"]) → ghiloRandom(0, 1) → rfRandom(1, 3) → mf1Random(0, 1) → rgRandom(1, 3) → mg1