
Combining Random Variables by Steve Phelps
Loading the math board and drawing, please wait…
In collections
AP Stats Exam Review
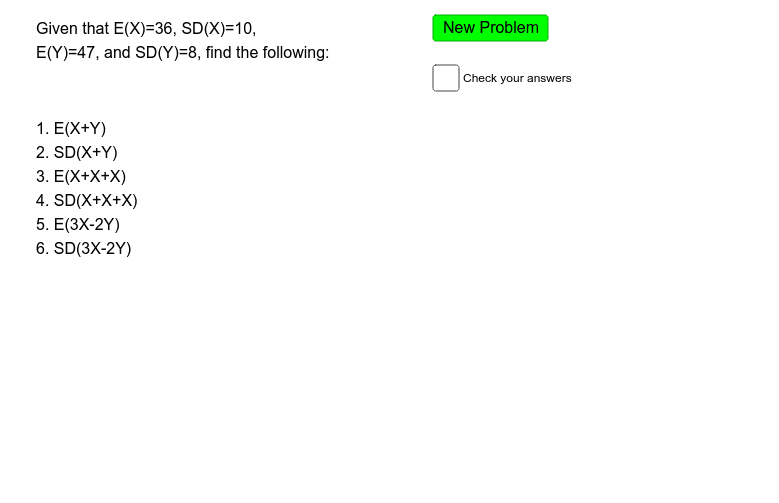
This example demonstrates how to calculate given values for combinations of random variables X and Y based on their provided means and standard deviations. It involves core concepts in probability & statistics, including random variables, means, and standard deviations. GeoGebra commands/objects used include RandomElement, Random, s, m, button1, mux, sdx, muy, sdy, text2, text1_1, text1, text3, text4, a for construction. Suitable for high school students and educators exploring probability statistics.
GeoGebra Commands & Parameters
RandomElement({-3, -2, 2, 3, 4}) → sRandomElement({0.25, 0.5, 0.75, 2, 3, 4}) → mRandom(20, 50) → muxRandom(5, 15) → sdxRandom(20, 50) → muyRandom(5, 15) → sdy
AI Drawing Prompt Reference
Draw a graph showing the combination of random variables. Include two random variables X and Y, represented by random elements for their possible values. Show their means and standard deviations generated randomly. The graph should clearly illustrate the relationship between these random variables to help understand probability and statistics concepts.
The prompt above was compiled from the original drawing commands and is for reference only.