
Colored Counters
Loading the math board and drawing, please wait…
In collections
Concrete-Pictorial-Abstract and the Teaching for Mastery
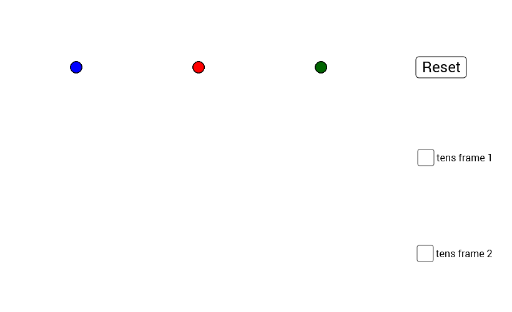
This example demonstrates ratios and intersection of sets using colored counters, involving core math concepts like algebra, arithmetic operations, ratios, and probability & statistics (Poisson Distribution). It constructs lines using the Segment command with objects A-Z, A_1-L_1, button1, and A1-A3, suitable for middle school and above to understand ratios, set operations, and basic probability statistics.
GeoGebra Commands & Parameters
Segment(C1, C6) → gSegment(D1, D6) → hSegment(C6, D6) → iSegment(C5, D5) → jSegment(C4, D4) → kSegment(C3, D3) → lSegment(C2, D2) → mSegment(C1, D1) → nSegment(B1, B6) → pSegment(G1, G6) → fSegment(G6, E6) → qSegment(E6, E1) → rSegment(E1, G1) → sSegment(F1, F6) → tSegment(G2, E2) → aSegment(G3, E3) → bSegment(G4, E4) → cSegment(G5, E5) → d
AI Drawing Prompt Reference
Draw a geometric pattern consisting of multiple line segments, including two sets of parallel lines, each set with three lines in different colors. These segments intersect each other, forming a complex design that illustrates the intersection of sets and ratios. Start by drawing two main horizontal segments, then add three parallel segments to them, and finally connect these segments to create multiple intersections and regions, showcasing a visual representation of geometry and probability statistics.
The prompt above was compiled from the original drawing commands and is for reference only.