
Histograms with Different Widths
Loading the math board and drawing, please wait…
In collections
Concrete-Pictorial-Abstract and the Teaching for Mastery
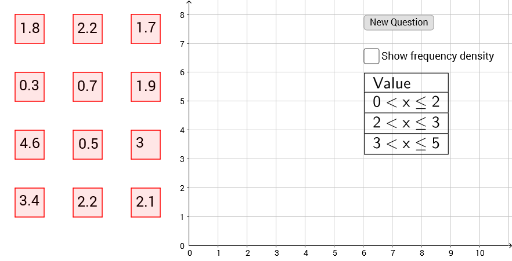
This example demonstrates how to create histograms with varying bin widths using GeoGebra, illustrating changes in data distribution. Key math concepts include data statistics, frequency distribution, and histogram construction. Construction highlights the use of commands like CountIf for frequency calculation, Polygon for bar drawing, If for conditional logic, TableText for data display, and Histogram for plotting. Suitable for high school mathematics teaching, particularly in probability & statistics and data analysis introductory lessons.
GeoGebra Commands & Parameters
CountIf(B7, list1) → C2CountIf(B5, list1) → C1Polygon(A, B, C, D) → poly1, a, b, c, dPolygon(A_1, B_1, C_1, D_1) → poly1_1, a_1, b_1, c_1, d_1Polygon(A_2, B_2, C_2, D_2) → poly1_2, a_2, b_2, c_2, d_2Polygon(A_3, B_3, C_3, D_3) → poly1_3, a_3, b_3, c_3, d_3Polygon(A_4, B_4, C_4, D_4) → poly1_4, a_4, b_4, c_4, d_4Polygon(A_5, B_5, C_5, D_5) → poly1_5, a_5, b_5, c_5, d_5Polygon(A_6, B_6, C_6, D_6) → poly1_6, a_6, b_6, c_6, d_6Polygon(A_7, B_7, C_7, D_7) → poly1_7, a_7, b_7, c_7, d_7Polygon(A_8, B_8, C_8, D_8) → poly1_8, a_8, b_8, c_8, d_8Polygon(A_9, B_9, C_9, D_9) → poly1_9, a_9, b_9, c_9, d_9Polygon(A_{10}, B_{10}, C_{10}, D_{10}) → poly1_{10}, a_{10}, b_{10}, c_{10}, d_{10}Polygon(A_{11}, B_{11}, C_{11}, D_{11}) → poly1_{11}, a_{11}, b_{11}, c_{11}, d_{11}If(D1 ≟ E1, Random[21, 30] / 10, Random[0, 20] / 10) → A11If(D2 ≟ E2, Random[21, 30] / 10, Random[31, 50] / 10) → A12CountIf(B5, list2) → C5CountIf(B6, list2) → C6CountIf(B7, list2) → C7TableText({{B4, C4, D4}, {B5, C5, D5}, {B6, C6, D6}, {B7, C7, D7}}, "|_") → text13TableText({{B4}, {B5}, {B6}, {B7}}, "|_") → text14Histogram({0, 2, 3, 5}, list3) → f