
Coin-Toss Randomness Demo #9: From Sequences to Probability
Loading the math board and drawing, please wait…
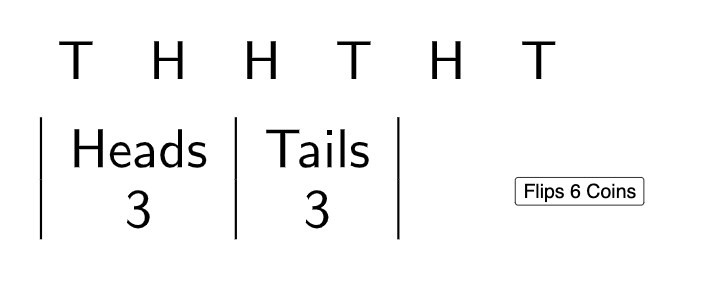
This example generates repeated coin-toss outcomes to form a random sequence and displays a corresponding table, helping learners see how randomness fluctuates while statistical probability patterns emerge over time. The key mathematical ideas are probability and stochastic (random) processes, illustrated through counting/organizing results into frequency-like summaries. Construction in GeoGebra relies on the commands Sequence and TableText, with the main objects including coins (the random trial/coin system) and several text elements (text1, text2, text3) to present the evolving results and/or computed summaries, while button1 provides interactive control to regenerate or advance the process. Suitable for middle/high school probability instruction, classroom demonstrations, and interactive exploration for students learning how empirical randomness relates to theoretical probability.
GeoGebra Commands & Parameters
Sequence(RandomElement[{"H", "T"}], a, 1, 6) → coinsTableText({"Heads", "Tails"}, {CountIf[x ≟ "H", coins], CountIf[x ≟ "T", coins]}, "c|h") → text2TableText(coins) → text3
AI Drawing Prompt Reference
This is a graphic that demonstrates randomness and probability, featuring symbols like 'H' and 'T' to represent coin toss outcomes. A table displays the counts of 'Heads' and 'Tails', along with a text element summarizing the results. A button allows users to regenerate or advance the process, showing how random sequences evolve over time.
The prompt above was compiled from the original drawing commands and is for reference only.