
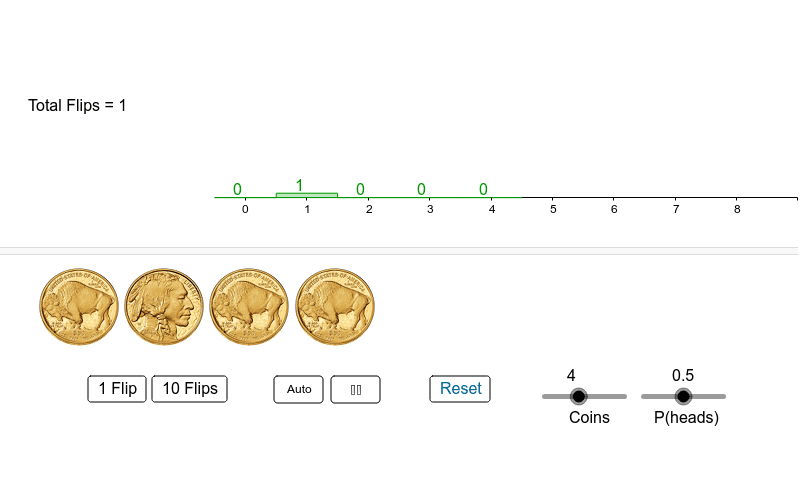
Coin Flip Simulation
Loading the math board and drawing, please wait…
In collections
Statistics Demonstrations
Statistics Demonstrations
Statistics Demonstrations
Statistics Demonstrations
Statistics Demonstrations
Probability Applets
This example demonstrates the distribution of the number of heads in coin flip experiments, exploring binomial probabilities and frequency distributions. It involves core math concepts like binomial distribution, frequency distribution, and statistics. Constructed using GeoGebra commands and objects such as Sequence, SelectedIndex, If, and BarChart. Suitable for high school students learning probability statistics and data analysis.
GeoGebra Commands & Parameters
Sequence(Element[freq, k], k, 1, coins + 1) → freq2Sequence(Element[freq2, k] / n, k, 1, Length[freq2]) → relFreqSelectedIndex(graphMenu) → graphTypeSequence(k - 1, k, 1, coins + 1) → numHeadsIf(n ≟ 0, 0, Max[freq]) → fMaxBarChart(numHeads, relFreq) → relFreqChartIf(n ≟ 0, 0, Max[relFreq]) → relMaxBarChart(numHeads, freq2) → freqChartSequence(Text["" + (Element[freq2, k]), (k - 1.2, Element[freq2, k] + step)], k, 1, Length[freq2]) → lblSequence(Text["" + (Element[relFreq, k]), (k - 1.3, Element[relFreq, k] + step)], k, 1, Length[relFreq]) → lbl2
AI Drawing Prompt Reference
Create a bar chart to illustrate the distribution of the number of heads in coin flip experiments, showing both frequency and relative frequency distributions. Use sequences to generate the x-axis values (number of heads) and y-axis values (frequency and relative frequency) for the two bar charts. Label each bar with its frequency and relative frequency values to clearly display the data distribution.
The prompt above was compiled from the original drawing commands and is for reference only.