
Chi-Square Test Simulation
Loading the math board and drawing, please wait…
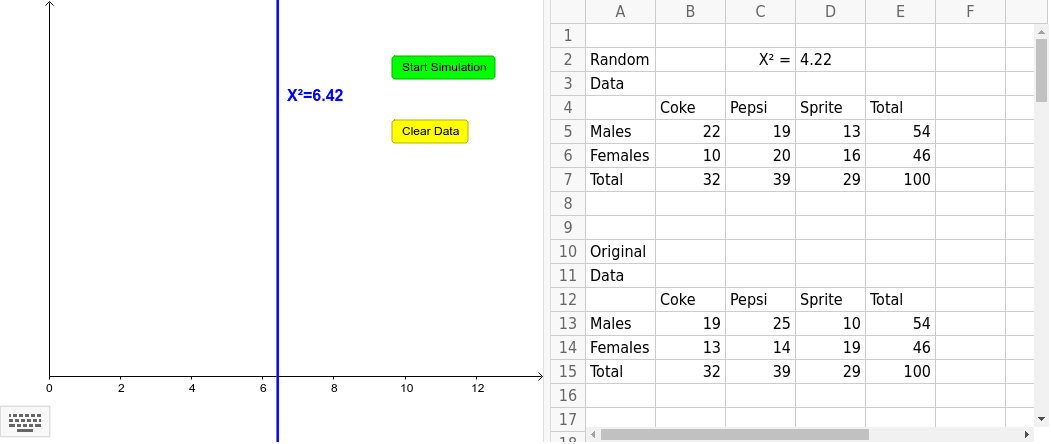
This example demonstrates the statistical process and distribution characteristics of the Chi-Square test. It involves core math concepts like probability & statistics, Chi-Square distribution, data simulation, and hypothesis testing. The construction uses GeoGebra commands and objects such as Shuffle, Take, CountIf, ChiSquaredTest, DotPlot, Point, Element for data generation and visualization. Suitable for high school and above mathematics and statistics education, helping to understand statistical inference methods.
GeoGebra Commands & Parameters
Shuffle(list2) → list3Take(list3, 1, 54) → list4Take(list3, 55, 100) → list5CountIf(x ≟ "pepsi", list4) → C5CountIf(x ≟ "sprite", list4) → D5CountIf(x ≟ "coke", list5) → B6CountIf(x ≟ "pepsi", list5) → C6CountIf(x ≟ "sprite", list5) → D6CountIf(x ≟ "coke", list4) → B5ChiSquaredTest(matrix1) → list6DotPlot(data, true) → list7ChiSquaredTest(matrix2) → list8Point(a) → AElement(list6, 2) → D2
AI Drawing Prompt Reference
Create a statistical graphic simulating a chi-square test. Start with a shuffled list of 100 drink brand labels (coke, pepsi, sprite), then split it into two groups of 50 each. Count the frequency of each brand in both groups to form a 2x3 contingency table. Compute the chi-square test statistic from this table and display its value. Also, show a dot plot of the original data, with each dot representing a sample, colored by brand. Add a slider to adjust the significance level, and display the corresponding critical value, allowing visual comparison between the test statistic and the critical value.
The prompt above was compiled from the original drawing commands and is for reference only.