
Changing Quantities of Red and Blue Paint in a Fixed Ratio
Loading the math board and drawing, please wait…
In collections
The variable-parts perspective across the curriculum
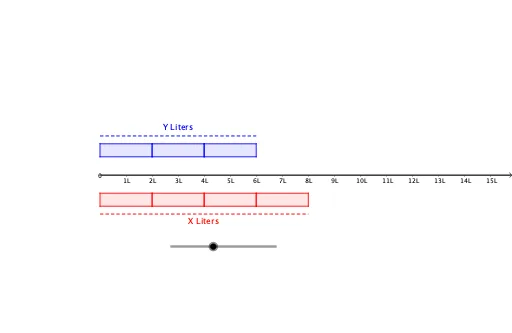
This example demonstrates how the quantities of red and blue paint change under a fixed ratio. Key mathematical concepts include ratio and linear functions. Using GeoGebra commands such as Point, Intersect, Rotate, etc., you can dynamically adjust the ratio and observe the changes in paint quantities. Suitable for students at the junior high school level and above to learn about ratios and linear functions.
GeoGebra Commands & Parameters
Point(xAxis) → AIntersect(xAxis, yAxis) → BRotate(A, α, B) → A'Angle(A, B, A') → βRay(B, A') → fOrthogonalLine(B, f) → gCircle(B, 0.7) → cIntersect(c, g, 2) → CIntersect(c, yAxis, 1) → DCircle(D, 0.5) → dCircle(C, 0.5) → eIntersect(e, g, 2) → EIntersect(d, yAxis, 1) → FLine(D, xAxis) → hLine(F, h) → iLine(C, f) → jLine(E, f) → kCircle(F, a) → pCircle(E, a) → qIntersect(p, i, 2) → GIntersect(q, k, 2) → HCircle(G, a) → rIntersect(r, i, 2) → ICircle(I, a) → sIntersect(s, i, 2) → JCircle(J, a) → tIntersect(t, i, 2) → KCircle(H, a) → c_1Intersect(c_1, k, 2) → LCircle(L, a) → d_1Intersect(d_1, k, 2) → MCircle(F, 0.3) → e_1Circle(E, 0.3) → f_1Intersect(e_1, yAxis, 1) → NIntersect(f_1, g, 2) → OLine(O, k) → lLine(N, i) → mLine(M, g) → nOrthogonalLine(K, i) → bIntersect(m, b) → PIntersect(l, n) → QIntersect(j, n) → RIntersect(h, b) → SLine(L, n) → g_1Line(H, g_1) → h_1Line(J, b) → i_1Line(I, b) → j_1Line(G, b) → k_1Intersect(j, h_1) → TIntersect(j, g_1) → UIntersect(h, k_1) → VIntersect(h, j_1) → WIntersect(h, i_1) → ZSegment(N, P) → l_1Segment(O, Q) → m_1Polygon(F, G, V, D) → q1, f_2, g_2, v, d_2Polygon(G, I, W, V) → q2, g_3, i_2, w, v_1Polygon(I, J, Z, W) → q3, i_3, j_2, z_1, w_1Polygon(J, K, S, Z) → q4, j_3, k_2, s_1, z_2Polygon(C, T, H, E) → q5, c_2, t_1, h_2, e_2Polygon(T, U, L, H) → q6, t_2, u, l_2, h_3Polygon(U, R, M, L) → q7, u_1, r_1, m_2, l_3
AI Drawing Prompt Reference
Draw a coordinate system with a point on the x-axis and the origin at the intersection with the y-axis. Rotate the point around the origin by angle α to get a new point. Draw a circle centered at the origin and intersect it with the rotated line at two points. Create smaller circles centered at these points and intersect them with the line. Repeat this process to form multiple geometric shapes, connecting the centers and intersection points to show linear functions and ratio relationships.
The prompt above was compiled from the original drawing commands and is for reference only.